Residential Natural Gas Explosion

By ThinkReliability Staff

The town of Allentown, Pennsylvania suffered severe physical and emotional damage on February 9, 2011, when 5 people were killed and 8 homes were completely destroyed.  The deaths and destruction were believed to be caused by a natural gas explosion, fueled by a 12″ gas main break.  In addition to the impacts to the safety and property goals, the natural gas leak, extended fire, and time/labor by 53 responders also impacted goals.

We can analyze the causes of these impacts to the goals with a visual root cause analysis.  Beginning with the impacts to the goals, we ask why questions to determine the causes that contributed to the incidents.  In this case, there was a delay in putting out the fire because the fire had a heat source from the explosion, a constant oxygen source (the environment) and a steady supply of fuel, as the natural gas continued to leak.  There was no shut-off valve to quickly stop the flow of gas.  It took the utility company 5 hours to finally turn off the gas.  It took 12 more  hours before the fire was completely put out.

The fuel for the explosion and the fire is believed (according to the utility company) to have come from a break discovered in the 12″ gas main.  A 4′ section of pipe, removed on February 14th, is being sent for a forensic analysis to aid in determining what may have contributed to the crack.  It’s possible there was prior damage – such as that from weather or prior excavations.  Most of the pipe in the area was installed in the 1950s, although some is believed to be from the 1920s.  Budget shortfalls have delayed replacing, or even inspecting the lines in the area, and officials have warned that continuing financial issues may continue to delay inspections and improvements,  causing concern with many residents, who suffered a similar natural gas pipeline explosion in 1994.

Because implementation of potential solutions to improve the state of the utility lines in the area may be limited by available funding, it’s unclear what will be done to attempt to reduce the risk of a similar incident in the future.   However, the unacceptability of resident casualties should stir some action so that this doesn’t happen again.

The Phillips 66 Explosion: The Rise of Process Safety Management in the Petrochemical Industry

By ThinkReliability Staff

Many of the industrial safety standards that we take for granted are the direct result of catastrophes of past decades.  Today there are strict regulations on asbestos handling, exposure limits for carcinogens, acceptable noise levels, the required use of personal protective equipment, and a slew of other safety issues.  The organization charged with enforcing those standards is the Occupational Health and Safety Administration – OSHA for short.

OSHA was founded in 1970, in an effort to promote and enforce workplace safety, and their stated mission is to “assure safe and healthful working conditions for working men and women”.  However, there was considerable controversy during its early years as it spottily began enforcing, what was perceived as, cumbersome and expensive regulations.  Notable events in the 1980s, such as the Bhopal and West Virginia Union Carbide industrial accidents, raised OSHA’s awareness that fundamental changes were needed to develop more effective safety management systems.

This awareness led to the rise of what is now known as Process Safety Management (PSM).  This discipline covers how industries safely manage highly hazardous chemicals.  OSHA’s PSM standard lays forth multiple requirements such as employee and contractor training, use of hot work permits, and emergency planning.  Unfortunately PSM was still a work-in-progress during the fall of 1989.

On October 23, 1989, the Phillips 66 Petroleum Chemical Plant near Pasadena, Texas, then producing approximately 1.5 billion of high-density polyethylene (HDPE) plastic each year, suffered a massive series of explosions.  23 died and hundreds were injured in an explosion that measured at least 3.5 on the Richter scale and destroyed much of the plant.  Many of the deficiencies identified at the Phillips 66 plant were in violation of OSHA’s PSM directives; directives which had been announced, but had not yet been formally enacted.

Looking at the Phillips 66 Explosion Cause Map, one can see how a series of procedural errors occurred that fateful day.  Contract workers were busy performing a routine maintenance task of clearing out a blockage in a collection tank for the plastic pellets produced by the reactor.  The collection tank was removed, and work commenced that morning.  However, at some point just after lunch, the valve to the reactor system was opened, releasing an enormous gas cloud which ignited less than two minutes later.

The subsequent OSHA investigation highlighted numerous errors.  First, the air hoses used to activate the valve pneumatically were left near the maintenance site.  When the air hoses were connected backwards, this automatically opened the valve, releasing a huge volatile gas cloud into the atmosphere.  It is unknown why the air hoses were reconnected at all.  Second, a lockout device had been installed by Phillips personnel the previous evening, but was removed at some point prior to the accident.  A lockout device physically prevents someone from opening a valve.  Finally, in accordance with local plant policy but not Phillips policy, no blind flange insert was used as a backup.  The insert would have stopped the flow of gas into the atmosphere if the valve had been opened.  Had any of those three procedures been executed properly, there would not have been an explosion that day.  According to the investigation, contract workers had not been adequately trained in the procedures they were charged with performing.

Additionally, there were significant design flaws in the reactor/collector system.  The valve system used had no mechanical redundancies; the single Demco ball valve was the sole cut-off point between the highly-pressurized reactor system and the atmosphere.  Additionally, there was a significant design flaw with the air hoses, as alluded to earlier.  Not only were the air hoses connected at the wrong time, but there was no physical barrier to prevent them from being connected the wrong way.  This is the same reason North American electrical plugs are mechanically keyed and can only be plugged in one way.  It can be bad news if connected incorrectly!  Connecting the air hoses backward meant the valve went full open, instead of closed.  Both of these design flaws contributed to the gas release, and again, this incident would not have occurred if either flaw was absent.

In hindsight, one can see how multiple problems led to such devastating results.  To easily understand the underlying reasons behind the Phillips 66 Explosion of 1989, a high-level Cause Map provides a quick overview of the event.  Breaking a section of the Cause Map down further can provide significant insight into the multiple reasons the event occurred.  The associated PDF for this case shows how different levels of a Cause Map can provide just the right amount of detail for understanding a complex problem such as this one.

The Phillips 66 explosion was a tragedy that could have been avoided.  The industrial safety standards that OSHA is charged with enforcing aim to prevent future tragedies like this one.  While a gradual safety-oriented transformation has come with some pain and a price tag, few will argue that such standards are unnecessary.  Industrial workers deserve to work in an environment where risk to their health has been reduced to the most practical level.
Aging Natural Gas Pipeline Finally Fails

By ThinkReliability Staff

Few ever contemplate the complex system of utilities surrounding us.  The beauty of our modern standard of living is that usually there is little reason to think about those things.  Those rare cases where power isn’t available at the flip of a switch, or fresh water at the turn of a faucet usually make the local news.

Sadly, the community of San Bruno was faced with much more than simple inconvenience.  On September 9, 2010, an explosion ripped through the suburban community, ultimately killing 8 and destroying or damaging 100 homes.  The explosion was caused by a ruptured natural gas pipeline, and it appears that a slight increase in pipe pressure led to the final failure.  That change in pressure resulted from a glitch in maintenance procedures at a pipeline  terminal.  While ultimately that glitch may have been the “straw that broke the camel’s back”, it is clear from the Cause Map analysis that the straw pile was already fairly high.

Based on National Transportation Safety Board reports, both poor pipe construction and inadequate record-keeping played a major role in the failure.  The pipes, at or near their life expectancy, were already considered too thin by the 1950s’ standards when they were originally installed.  Furthermore improperly done welding made the pipes susceptible to corrosion.  Compounding these issues was the fact that PG&E, the utilities company responsible the pipeline, wasn’t even aware that the San Bruno pipeline had such extensive welding.  This matters because gas pressures are calculated based on a number of inputs, including the construction of the pipeline.  Even that slight increase in pressure proved to be more than the aging pipe could handle.

Natural gas pipelines are fairly extensive in the United States, and with suburban sprawl many communities live close to these pipelines.  In fact, many states have already taken steps to prevent similar events from occurring in their community.  Multiple utilities companies have been mandated to install newer pipelines, as in Texas and Washington.  Additionally, the federal government requires that newly constructed pipelines must be inspected by “smart pigs” – robots able to maintain and inspect pipeline systems.  However, modernizing this aging infrastructure will be expensive for many communities.

Perhaps there are easy, inexpensive interim solutions available.  The Cause Map analysis identifies all causes leading to the explosion, and then provides a systematic method for developing solutions.  Hopefully some of the solutions generated will prevent future disasters, like the one in San Bruno.

Is a College Education Worth the Price?

By Kim Smiley

Most students go to college hoping it will further their education and allow them better career opportunities upon graduation.  But is the investment of time and money required to get a college education worth it?

The cost of college has been rapidly increasing over the last several years.  At the same time, many company executives have been noting that today’s students do not graduate college with the critical thinking skills necessary to succeed.  A new book, “Academically Adrift: Limited Learning on College Campuses,” by sociologists Richard Arum of New York University and Josipa Roksa of the University of Virginia publishes findings of a study that says that students aren’t improving much in the areas of “critical thinking, complex reasoning and writing” during their four years in college.

The study based its results on assessment scores taken by 2,300 students as they entered college, after two years, and after four years.  After two years, 45% of students showed insignificant improvement and after four years, 36% showed insignificant improvement.  The study also found that very little reading and writing is required in many college courses.

The findings indicate that students aren’t being adequately prepared for their future careers.  How do we solve this problem?  Similar to engineering problems, a root cause analysis could be performed to help understand and hopefully solve this problem.  The more clearly a problem is understood, the easier it is to develop and implement solutions.  There are some potential solutions that have been suggested already, but only time will tell if they are successful.

Many institutions of higher learning are working to combat the issue.  More than 70 college and university presidents have pledged to take steps to improve instruction and student learning, and make those results public.  Hopefully the colleges and universities that have pledged to use evidence-based solutions to improve learning will pave the way for all colleges and universities increasing the critical thinking and writing skills of all college graduates.

There are also a number of things that students can do to improve their own learning.  The study found that students who study alone (as opposed to in study groups) are more likely to post gains over college.  Additionally, students who choose to read and write more, and attend more selective schools that focus on teaching rather than research tend to improve their critical thinking and writing skills over their years at college.

Everyone should agree that a large percent of students graduating from college showing little or no improvement in critical reasoning and writing skills is not a desirable outcome – i.e. a problem.  There are many ways to improve the situation.  Some of these solutions must be implemented by the universities themselves, but students can take many actions themselves to increase their learning over their college years.

Click here to read more about this topic.

More Info about Deadly Mine Explosion

By Kim Smiley

Around 3 pm on April 5, 2010 in Montcoal, West Virginia, a huge explosion rocked the Upper Big Branch South mine killing 29 (Click here to read previous blog on the topic).  The toxic gas concentration in the mine remained so high after the accident that Mine Safety and Health Administration investigations were not able to enter the mine for more than two months after the accident.  The final report is still two to three months away, but the MSHA has developed a working theory on what caused the mine explosion.

According to a recent NPR article, investigators believe they have found the source of the spark that started the chain of events that lead to the massive mine explosion.  A longwall mining machine was in operation inside the mine, creating sparks as it ate through both coal and sandstone.  Sparking may have been worse than usual because investigators found that the carbide tipped teeth on the machine were worn down so that bare metal was contacting the stone and coal.

Sparks are expected during these types of operations so a water sprayer system is typically used to prevent explosions from occurring, but investigations found the water system in Upper Big Branch was not functioning properly.  Additionally, a properly functioning water spray system would help control the amount of coal dust in the air.  Coal dust is an accelerant, which means it will contribute to an explosion if ignited.

Another cause of this accident is the level of methane gas in the environment.  The Upper Big Branch South mine is a particularly gassy mine that naturally emitted high levels of methane gas.  There are still some open questions about the role ventilation may have played in the accident.

Small ignitions of methane gas are not uncommon in coal mines, but large explosions are rare.  According to data collected by Mine Safety and Health News, about 600 ignitions have occurred in the past 10 years without any major mine explosions occurring.

Coal mining involves managing a tricky combination of coal dust, methane and sparks.  Usually, no one gets hurt, but in this case the mixture resulted in a massive explosion that traveled more than two miles inside the mine and claimed the lives of 29.  Performing a thorough root cause analysis can help investigators understand what was different in this case and hopefully help the lessons learned be applied to other mines.

As more information comes available, the Cause Map can be expanded to include all relevant details.  Click “Download PDF” above to view the intermediate level Cause Map for this example.

Why Don’t All School Buses Have Seat Belts?

By Kim Smiley

Nearly every state in the US has a law requiring seat belts to be worn in cars. The lone state that doesn’t require adults to wear seat belts, New Hampshire, still has a law requiring children under 18 to wear seat belts.

Currently, only 6 states require seat belt in school buses.  The federal government does not require seat belts to be in installed in buses weighing over 10,000 lbs.  The regular school buses that make up 80 percent of the buses in this country exceed this weight limit and most do not have seat belts.

So if seat belts are required by law in cars, why don’t all school buses have seat belts?

Like most engineering problems, this isn’t as simple a question as it first appears.  The main reason that seat belts aren’t required on all buses is that buses are fundamentally different from cars.

School buses are heavier and taller than cars.  During an accident, a passenger on a bus experiences less severe crash forces than an occupant of a passenger car.  The interior of a modern school bus is designed to protect passengers passively through something called compartmentalization.  The seats are strong, closely-spaced, high backed, and covered in 4 inch thick foam to absorb energy.  The passenger is protected by the cushioned compartment created by the seats.

Buses are considered to be the safest form of ground transportation.  According to the National Highway Traffic Safety Administration, buses are approximately seven times safer than passenger cars or light trucks.

But would seat belts make them even safer?

This is subject to debate.  There are groups pushing for the federal government to require seat belts on all buses.  Others believe that the potential for misuse and incorrectly worn seat belts would actually result in a higher risk to safety if seat belts were installed.  There are also practical considerations like finding funding in cash strapped budgets to install seat belts and to buy the extra buses that would be necessary since fewer students can be accommodated on a bus with seat belts than one without.

There are few topics touchier than the safety of children and no clear cut answers to the question of what constitute a design that is safe enough.  It could be useful when dealing with a problem like this where emotions might run high to document all information in a Cause Map.  A Cause Map is a visual root cause analysis that incorporates the information associated with an issue in an easy to read format.  All pertinent evidence and facts associated with the topic can be recorded.  Having the same facts available to all invested parties can help keep the discussion production and uncover the best solutions.

To learn more about school bus safety, please visit the National Transportation Safety Board website and National Highway Traffic Safety Administration website.

Metrodome Collapsed

By Kim Smiley

At about 5 am in the morning on Sunday, December 12, 2010, the roof of the Metrodome collapsed under the weight of snow accumulated during the heaviest snow storm in almost two decades.  According to the National Weather Service, Minneapolis received a whopping 17.1 inches of snow between Friday and Saturday night.

The Metrodome is home to the Minnesota Vikings and its collapse set off a multicity scramble as the NFL worked to reschedule the Monday night game between the Vikings and the Giants that was planned to take place in the Metrodome on December 13.  After considering all the options, the game was moved to Detroit.  (Ironically, this was the first Monday night game played in Detroit in a decade because of the Detroit Lions’ abysmal record.)

Despite some early optimism, the latest update is that repairs will not be completed until March. The damage to the Metrodome moved the last two games of the Vikings’ season and will impact the schedule of about 300 college baseball games along with many other events planned in the venue.  In addition to the massive schedule impact, the cost associated with the repairs will be significant.

Why did this happen?

A Cause Map can be started using the information that is known.  To build a Cause Map, begin with the impacted goals and add Causes by asking why questions.  In this case, the impacted goals considered are the Production-Schedule goal and the Safety goal.  Fortunately, there were no injuries during the collapse, but the impact to this goal is included because of the potential for injuries if the Metrodome collapsed while occupied.  Click on the “Download PDF” button above to see the initial Cause Map built for this example.

The Metrodome design includes an inflatable dome to protect the venue from the harsh Minnesota winters.  The massive amount of snow accumulation on the dome after the severe storm exceeded the capacity of the dome to stay inflated.  The dome is made of two layers of materials (the outside layer is Teflon coated fiberglass and the inner layer is made from a proprietary acoustical fabric) and air is constantly pumped into the space between the layers to keep it inflated.  The massive weight of the snow tore the roof in several places and it collapsed.

The high winds that accompanied the snow fall were also one of the causes contributing to this accident.  When there are heavy snow falls, workers typically climb on the roof of the Metrodome and use steam and high powered hot water hoses to melt snow and limit accumulation.  Workers were unable to access the roof due to safety concerns because of the strong winds.  Additionally, the other measures used to prevent accumulation were inadequate.  These measures include pumping hot air into the dome and heating the stadium to about 80 degrees to help melt snow.

To view a video of the Metrodome collapsing from inside dome click here.

Printing Issues with New $100 Bill

By ThinkReliability Staff

In October, the U.S. government discovered that some of the newly redesigned $100 bills were coming off the printing press with blank spots caused by creases in the paper at both sites of the Bureau of Engraving and Printing, Washington, D.C. and Fort Worth, Texas.  The government has recently announced that this will cause a delay in the introduction of these bills, planned for the spring of 2011.

Additionally, the bills that have blank spots will have to be  shredded and reprinted.  Because of complex new security features aimed at deterring counterfeiters (such as a 3-D security strip woven into the paper), the bills cost $0.12 to print.  Hundreds of millions of bills have been printed, with a possible cost of this issue in the millions of dollars.

 Although issues with currency are expensive, they’re also rare. The last time that a printing issue caused a delay in the introduction of a new bill was 1987.  It’s unclear at this point when the bills will finally be released.

It’s also unclear what happened to cause the paper to crease, creating blank spots from printing.  The additional complexity of this bill with the additional security features is being looked at, as are issues with the paper and the printing machines.  However, because similar errors occurred at both printing sites, it’s unlikely that there is a specific issue with just one site’s machines.  Although the investigation into what caused the blank spots is ongoing, we can begin a root cause analysis with what is currently known.  Once more information is discovered, the Cause Map can be updated.

Because of the high potential financial losses from this issue, the eventual investigation will likely go into great  detail and to determine fully what happened will take some time.  The Cause Map and outline for the information known now can be viewed by clicking “Download PDF” above.

Shuttle Launch May Be Delayed Again

By ThinkReliability Staff

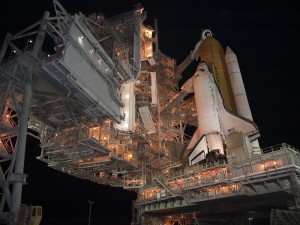
NASA’s plan to launch Discovery on its final mission continues to face setbacks.  As discussed in last week’s blog, the launch of Discovery was delayed past the originally planned launch window that closed on November 5 as the result of four separate issues.

One of these issues was a crack in a stringer, one of the metal supports on the external fuel tank.  NASA engineers haven identified additional stringer cracks that must also be repaired prior to launch.  These cracks are typically fixed by cutting out the cracked metal and bolting in new pieces of aluminum called doublers because they are twice as thick as the original stringers. The foam insulation that covers the stringers must then be reapplied.  The foam needs four days to cure, which makes it difficult to perform repairs quickly.

Adding to the complexity of these repairs is the fact that this is the first time they have been attempted on the launch pad. Similar repairs have been made many times, but they were performed in the factory where the fuel tanks were built.

Yesterday, NASA stated that the earliest launch date would be the morning of December 3.  If Discovery isn’t ready by December 5, the launch window will close and the next opportunity to launch will be late February.

NASA has stated that as long as Discovery is launched during the early December window the overall schedule for the final shuttle missions shouldn’t be affected.  Currently, the Endeavor is scheduled to launch during the February window and it will have to be delayed if the launch of Discovery slips until February.

In a situation like this, NASA needs to focus on the technical issues involved in the repairs, but they also need to develop a work schedule that incorporates all the possible contingencies.  Just scheduling everything is no easy feat.  In additional to the schedule of the remaining shuttle flights, the timing of Discovery’s launch will affect the schedule of work at the International Space Station because Discovery’s mission includes delivering and installing a new module and delivering critical spare components.

When dealing with a complex process, it can help to build a Process Map to lay out all possible scenarios and ensure that resources are allocated in the most efficient way.  In the same way that a Cause Map can help the root cause analysis process run more smoothly and effectively, a Process Map that clearly lays out how a process should happen can help provide direction, especially during a work process with complicated choices and many possible contingencies.

Space Shuttle Launch Delayed

By ThinkReliability Staff

Launching a space shuttle is a complicated process (as we discussed in last week’s blog).  Not only is the launching process complex, finding an acceptable date for launch is also complex.  This was demonstrated this week as the shuttle launch was delayed four times, for four separate issues and now will not be able to happen until the end of the month, at the earliest.

There are discrete windows during which a launch  to the International Space Station (which is the destination of this mission) can occur.  At some times, the solar angles at the International Space Station would result in the shuttle overheating while it was docked at the Space Station.  The launch windows are open only when the angles are such that the overheating will not occur.

The previous launch window was open until November 5th.  The launch was delayed November 1st for helium and nitrogen leaks, November 2nd for a circuit glitch, November 4th for weather, and November 5th for a gaseous hydrogen leak.  After the November 5th delay, crews discovered a  crack in the insulating foam, necessitating repairs before the launch.  These delays pushed the shuttle launch out of the available November launch window.  The next launch window is from December 1st through 5th, which gives the shuttle experts slightly less than a month to prepare for launch, or the mission may be delayed until next year.

Although not a lot of information has been released about the specific issues that have delayed the launches, we can put what we do know into a Cause Map.  A thorough root cause analysis built as a Cause Map can capture all of the causes in a simple, intuitive format that fits on one page.  Once more information is released about the specifics of the issues that delayed the launch, more detail can easily be added to the Cause Map to capture all the causes for the delay.  Additionally, the timeline can be updated to reflect the date of the eventual launch.

To view the problem outline, Cause Map, and launch timeline, please click on “Download PDF” above.