Stuck in the Chunnel

By Kim Smiley

High-speed train service in the Channel Tunnel (connecting Britain, France and Belgium) resumed partially on Tuesday, December 22, 2009 after a complete stoppage that began Friday, December 18th when five trains failed inside the tunnel.

Eurostar, the operator of the train, has stated that the failure of the trains were caused by an electrical failure due to condensation from snow that was able to enter the snow screens protecting the engine and higher temperatures within the tunnel than outside. Unseasonably cold weather was believed to cause finer, lighter snow than usual, which was able to enter the screens.

There was a delay in rescuing the trapped passengers in the tunnel – some of whom were trapped for up to 18 hours. Responsibility for rescue lies with both the train operator and the tunnel operator, and the process for rescue obviously needs to be reviewed by both parties to determine a better course of action the next time a rescue plan is needed. Additionally, the train operator will want to review its policies based on the reports of abysmal customer service throughout the event.

Eurostar, British Rail Class 373 at St Pancras railway station by Oxyman (11/23/07)

Eurostar took immediate action to install finer filters on the engine intakes and trains were put back into service on Tuesday, the 22nd. The company has also stated it will reimburse passengers for the delay, but this solution will take longer to implement.

The entire root cause analysis investigation so far is shown on the downloadable PDF. A thorough root cause analysis built as a Cause Map can capture all of the causes in a simple, intuitive format that fits on one page. Even more detail can be added to this Cause Map as the analysis continues. As with any investigation the level of detail in the analysis is based on the impact of the incident on the organization’s overall goals. To view the PDF, click on “Download PDF” above.

Toyota Recall: Problems, Interim Solutions and Permanent Solutions

by Kim Smiley

On September 29, 2009, Toyota/Lexus issued a safety advisory that some 2004-2010 model year vehicles could be prone to a rapid acceleration issue if the floor mat moved out of place and jammed the accelerator pedal. Although the recall is only applicable in the U.S. and Canada because of the type of floor mats used, over 4 million vehicles are affected by the recall.

Although all the solutions to this problem have not yet been implemented, we can look at the issue so far in a Cause Map, or visual root cause analysis. First we define the problem. Here we could consider the problem the recall, or the acceleration problems. We can list all the models and years that are affected by the recall, and that the recall is limited to the U.S. and Canada.

We define the problem with respect to the organization’s goals. There have been at least 5 fatalities addressed by the National Highway Transportation Safety Administration (NHTSA), though some media outlets have reported more. Additionally, the NHTSA has reported 17 accidents (again, some claim more) and has received at least 100 complaints. The fatalities and accidents are impacts to the safety goal. Complaints are impacts to the customer service goal. The recall of more than 4 million cars is an impact to the production/schedule goal, and the replacement of the accelerator pedals and floor mats as a result of the recall is estimated to cost $250 million, which is an impact to the property goal.

Once we’ve completed the outline, we can begin the Cause Map, or the analysis step of the process. The fatalities are caused by vehicle crashes resulting from a loss of control of the vehicle. The loss of control is caused by a sudden surge of acceleration, inability to brake, and sometimes an inability to shut down the engine of the car. Toyota says the sudden bursts of acceleration are caused by entrapment of the accelerator pedal due to interference from floor mats. Toyota refutes the possibility that there may be a malfunction in the electronic control system, saying it’s been ruled out by Toyota research.

The vehicles are unable to brake because the brake is non-functional when the accelerator pedal is engaged, as it is in these cases. Additionally, owners whose models are equipped with keyless ignition cannot quickly turn off their ignition. These models require the ignition button to be pressed for 3 seconds to prevent inadvertent engine stops, and the instructions are not posted on the dashboard, so owners who weren’t meticulous about reading (or remembering) instructions from the owners’ manual may not know how to turn off the car while moving at very quick speeds.

When the Cause Map is complete to a sufficient level of detail, it’s time to explore some solutions. In this case, the permanent solutions (which will reduce the risk of these accidents most significantly) to be implemented by Toyota are to reconfigure the accelerator pedal, replace the floor mats, and install a brake override system which will allow the brakes to function even with the accelerator pedal engaged. However, designing and implementing these changes for more than 4 million cars will take some time, so owners of Toyotas require interim solutions. Interim solutions are those that do not sufficiently reduce the risk for long-term applicability but can be used as a stop-gap until permanent solutions are put in place. In this case, Toyota has asked owners to remove floor mats, and has put out guidance that drivers who are in an uncontrolled acceleration situation should shift the engine into neutral, which will disengage the engine and allow the brake to stop the car.

View the high level summary of the investigation by clicking “Download PDF” above.

Learn more about the recall at the NHTSA website.

Airlink Incidents: Viewing Trends in Visual Form

By ThinkReliability Staff

Over the past three months, South Africa’s Airlink airline has had four incidents, ranging from embarrassing to fatal. Four similar incidents such as these start to point out a trend, which should be investigated to improve processes and increase safety. But how do we start the investigation?

In the Cause Mapping root cause analysis method, we begin by defining the problem. Here we can define four problems, which are the four incidents over the last three months. We can look at one incident at a time in a problem outline, the first step of the Cause Mapping process. We’ll start with the earliest incident first.

On September 24, 2009 at approximately 8 a.m. a Jetstream 41 crashed into a school yard in Durban Bluff just after take-off from Durban International Airport. This was a forced landing necessitated by the loss of an engine. The pilot was killed. There were also two serious injuries of the crew, and a minor injury of a person on the ground. There were no passengers on the plane, and the impact to Airlink’s schedule is unclear. However, the plane was lost.

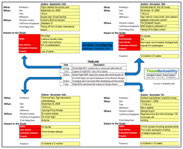
We can capture this information more clearly and succinctly in an outline. For example, the above paragraph has more than 80 words. The outline, which records the same information, uses only 42 words in an easily understandable visual form. (The outline for all three incidents can be viewed by clicking on “Download PDF” above.)

The second incident: On November 18, 2009 at 1:30 p.m. a BAE Systems Jetstream 41 aborted take-off for East London and slid off the runway at Port Elizabeth airport. There were high velocity cross winds, and the pilot may have been unable to establish directional control. There were no injuries, no environmental impact and damages to the plane are unknown. However, new travel arrangements had to be made by the airline for all the passengers. The frequency of Airlink incidents is now two in eight weeks. (Over 80 words; the outline has 49 words.)

The third incident: On November 24, 2009 at approximately 8 a.m. a flight en route to Harare carrying a Prime Minister was forced to return to Johannesburg Airport after it experienced a technical fault. There were no injuries, but it caused a delay in the Prime Minister’s schedule. The damage to the airplane is unclear. The frequency of Airlink incidents is now three in two months. (Over 60 words; the outline has 33 words.)

The fourth incident: On December 7, 2009 at approximately 11 a.m. a Regional airline SA Airlink Embraer 135 commuter jet hydroplaned and overshot the runway while landing at George Airport during rainy weather. There were five injuries, including a sprained ankle. This incident has led to a poor public perception of the airline and increased supervision from the authorities. We do not have a dollar amount on the property damage. The frequency of Airlink incidents is now 4 in 10 weeks. (Over 70 words; the outline has 42 words.)

In addition to the increased brevity of the outline, it provides an easy visual comparison of the four incidents by showing them in a similar visual form. On one page, we can show the timeline, and outlines of the four incidents for easy comparison. This is especially useful for a briefing tool for busy managers.

Another Train Collision for the Washington D.C. Metro

By ThinkReliability Staff

In the early morning hours of Sunday, November 29th, after the Washington D.C. Metro shut down for the night, train 902 pulled into the West Falls Church station for cleaning. However, instead of stopping just behind the parked train already on the tracks, it rammed into it.

We can put this incident into a Cause Map, or a visual form of root cause analysis. A thorough root cause analysis built as a Cause Map can capture all of the causes in a simple, intuitive format that fits on one page. The first step in the Cause Mapping process is to outline the problem. After entering the “what, when and where” we frame the incident with respect to the Washington Transity Authority’s goals.

The operator, plus two other employees who were on the parked car cleaning, suffered minor injuries. This is an impact to the safety goal. The train cars, however, suffered extensive damage. Three of the cars will have to be replaced (at a cost of $3 million per car) and the extent of the damage to the other 9 cars involved is unclear. These are both impacts to the property goal. There may have been other goals that were impacted, but these are the main concerns.

West Falls Church-VT/UVA station, photographed by Ben Schumin on July 28, 2001

The second step of the Cause Mapping process is the Cause Map itself, or the analysis of the problem. To fill out the Cause Map, we begin with the goals that were impacted and ask why questions. The injuries and damage were caused by the parked train being struck by a moving train. The moving train was not stopped in time because the automatic train control system was not on (it’s not used in the railyard) and the speed suddenly increased, OR the operator wasn’t paying attention. (We don’t know yet, at this point of the investigation.)

Another train operator has come forward to say that this type of car suffers from power surges at low speeds (such as speeds used in the rail yard), which could have caused the speed to suddenly increase. We add this information to the map, and also add an evidence box showing where the information came from. This can be invaluable when sorting through a lot of information.

Although it is known that the operator had surpassed a ten-hour shift, it’s not known if fatigue or other causes of inattentiveness were involved. A union representative has asserted that the training program was unsatisfactory, which may have also played a part. As the National Transportation Safety Board (NTSB) and the Transit Authority continues their investigation, more detail can be added to this Cause Map as the analysis. As with any investigation the level of detail in the analysis is based on the impact of the incident on the organization’s overall goals.