Release of Chemicals at a Manufacturing Facility

By ThinkReliability Staff

A recent issue at a parts plant in Oregon caused a release of hazardous chemicals which resulted in evacuation of the workers and in-home sheltering for neighbors of the plant.  Thanks to these precautions, nobody was injured.  However, attempts to stop the leak lasted for more than a day.  There were many contributors to the incident, which can be considered in a root cause analysis presented as a Cause Map.

To begin a Cause Map, first fill out the outline, containing basic information on the event and impacts to the goals.  Filling out the impacts to the goals is important not only because it provides a basis for the Cause Map, but because goals may have been impacted that are not immediately obvious.  For example, in this case a part was lost.
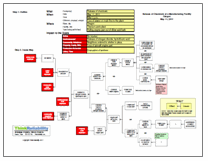
Once the outline is completed, the analysis (Cause Map) can begin.  Start with the impacts to the goals and ask why questions to complete the Cause Map.  For example, workers were evacuated because of the release of nitrogen dioxide and hydrofluoric acid.  The release occurred because the scrubber system was non-functional and a reaction was occurring that was producing nitrogen dioxide.  The scrubber system had been tripped due to a loss of power at the plant, believed to have been related to switch maintenance previously performed across the street.Normally, the switch could be reset, but the switch was located in a contaminated area that could only be accessed by an electrician – and there were no electricians who were certified to use the necessary protective gear.  The reaction that was producing the nitrogen oxide was caused when a titanium part was dipped into a dilute acid bath as part of the manufacturing process.

When the responders realized they could not reset the scrubber system switch, they decided to lift the part out of the acid bath, removing the reaction that was causing the bulk of the chemicals in the release.  However, the hoist switch was tripped by the same issue that tripped the scrubber system.  Although the switch was accessible, when it was flipped by firefighters, it didn’t reset the hoist, leaving the part in the acid bath, until it completely dissolved.

Although we’ve captured a lot of information in this Cause Map, subsequent investigations into the incident and the response raised some more issues that could be addressed in a one page Cause Map.  The detail provided on a Cause Map should be commensurate with the impacts to the goals.  In this case, although there were no injuries, because of the serious impact on the company’s production goals, as well as the impact to the neighboring community, all avenues for improvement should be explored.

To view the Outline and Cause Map, please click “Download PDF” above.  Or click here to read more.

Rioting in England

By ThinkReliability Staff

Rioting is a defined as a violent, public disorder caused by a group of persons.  It is a unique phenomenon in that it is difficult to pinpoint exactly what is going to trigger and sustain a riot.  Social scientists know that there is a tipping point at which participants no longer fear punishment (such as jail) as the number of gatherers increases.  However there are many common contributing factors.  A Cause Map can help sort out what led to this month’s rioting over in the United Kingdom.

It began on August 4th, following the police shooting of a 29-year old in North London.  The police claimed he was suspected of weapons possession and were attempting to execute a warrant.  During the arrest, the suspect was shot and killed.  However, questions arose regarding the circumstances of the arrest and family and friends came to believe that the victim, Mark Duggan, was unarmed.  This led to a peaceful protest of approximately 120, ending at the police station in Tottenham, North London.  Protestors demanded answers, and police officials seemed unable to satisfy the crowd.

The crowd lingered while police stalled, and grew as disgruntled local youths began to arrive at dusk.  At this point, things began to spiral out of control.  Why did this unsatisfied, but otherwise quiet gathering turn into a multi-day riot across an entire country?

According to social scientists, rioting generally occurs when there are certain elements present.  Normally there have to be a lot of people.  There also needs to be a low level of perceived risk that they will be punished for unacceptable behavior.  This perception generally increases as there are fewer law enforcement officers and also as there are more people.  Those people generally are upset about something.  There also needs to be a feeling that others are likely to join in.  But even with all these elements, a riot will not start.  The final element is a “catalyst”.  This is typically a person who has calculated that the risk of being targeted by law enforcement is sufficiently low, and acts out – such a throwing a rock through a window.

Examining the Cause Map reveals that these elements were present in the initial riot as well as in the general rioting that broke out across the country.  It becomes evident that the rioting was cyclical – the initial riot led to more widespread rioting.  And the same elements that were present in the initial riot were present in the widespread rioting as well.

After completing the Cause Map analysis, the next step is to determine how to prevent this from happening again.  Everyone seems to have an opinion on what went wrong, and more importantly what needs to be done differently to prevent such costly and dangerous behavior.  Resorting back to the Cause Map, we can look for opportunities to prevent future riots.  Some of the elements that contribute to a riot can be controlled more easily than others.  For instance it is easier to limit mass gatherings than control the emotions of a crowd.  Hence, greater police presence and an ability to clear the street – through curfew or quick arrests – are usually the best solutions for limiting riots.  A table of proposed solutions completes the analysis.

Greece Economic Woes – Part 2

By ThinkReliability Staff

In our previous blog about Greece’s economic woes, we looked at some of the impacts the recent events have had on Greece and potentially the rest of the European Union (EU) and a timeline of the events that are part of the ongoing economic crisis.  However, we stopped short of an analysis of what contributed to these impacts.

The outline, which we filled out previously, discusses an event or incident with respect to impacts to the goals of a country (economy, company, etc.).  An analysis of the causes of these impacts can be made using a Cause Map, or visual root cause analysis.  To do so, begin with one impacted goal and ask “why” questions to complete the analysis.  For example, Greece’s financial goal is impacted because its debt rating is just above default.  Why? Because the ratings agencies were concerned with Greece’s ability to repay.  Why? Because their debt to revenue ratio is too high.

Whenever you encounter a situation where a ratio is too high – such as this case, where debt is too high compared to revenue – it means that the Cause Map will have two branches.  Each part of the ratio is a branch.  In this case, if debt to revenue is too high, it means that debt is too high and revenue is too low.  Each branch can be explored in turn.  There have been cases made that only one or the other branch is important, but what we’re looking for in a Cause Map is solutions that can help ameliorate the problem.   Due to the severity of the issue in Greece, solutions that reduce debt and solutions that increase revenue must both be implemented in order to attempt to repair the financial standing.

Greece’s government debt is high – caused by government spending on borrowed money when the euro was strong and interest rates were low.  There are many parts to government spending, which can make their own Cause Map.  Suffice to say, reducing government spending – by a lot – is necessary to reduce the debt to revenue ratio.  Unfortunately, severe reductions in government spending also mean reductions in government services, and government salaries.  As an example, government workers, which total 25% of the total workforce, are seeing their pay reduced 10%.  As you can imagine, this reduced spending has angered some Greeks, causing riots, which have killed Greek citizens.  In this case, the solution “reduced spending” also becomes a cause in another branch of the Cause Map.  It’s important to remember that not all solutions are free of consequences and that solutions themselves may contribute to the overall problems.

Greece’s revenue is insufficient to fuel their current spending levels.   Tax revenue is decreased by tax evasion, high unemployment, and a shrinking economy.  The Cause Map isn’t simple here either, because the shrinking economy contributes to the unemployment rate, and decreased spending can result in decreased revenue.  The worldwide economic woes are contributing to the shrinking economy, but also low levels of foreign investment, caused by what is considered a difficult place to do business due to political, legal, and cultural issues.  Last but not least, many governments in Greece’s situation would devalue their currency in order to regain an economic edge.  However, Greece uses the Euro – so devaluing currency isn’t an option.  There has been some talk of Greece dropping the Euro but a bailout by the other EU countries (itself an impact to the goals) appears to have shelved that discussion for now.

In addition to reduced tax revenue, Greece is having trouble borrowing money.  As their credit rating has fallen (it now has the lowest credit rating in the world), interest rates for loans are climbing, so it is possible that Greece will still fall into bankruptcy and loans will not be repaid. This is caused by the debt to revenue ratio, and adds a circular reference to our map.  This is why the economic issue has been described as a spiral – the causes feed into each other, making it difficult to climb out.

However, Greece has made admirable strides to attempt to reduce their debt and increase their revenue.  Only time will tell if that, and the bailout from the EU, will be enough.

Train Crash in China Kills 39

By Kim Smiley

It is rare for the conduct of the investigation to be one of the biggest headlines in the week following an accident, but this has been the case after a recent train crash in China.  On July 23, 2011, two trains collided in Wenzhou, China, killing 39 and sending another 192 people to the hospital.

What appears to have happened is that a train moving at speed rear ended another train that had stalled on the tracks. It was announced that the first train had stalled after a lightning strike.  Soon after the accident, people reported seeing the damaged train cars broken apart by back hoes and buried.  Meaning the evidence was literally being buried without ever having been thoroughly examined.  The Chinese government stated that the cars contained “State-level” technology and were being buried to keep it safe.

The internet frenzy and public outrage fueled by how this investigation was handled was impressive. According to a recent New York Times article, 26 million messages about the tragedy have been posted on China’s popular twitter-like microblogs.  So powerful has the public outrage been that the first car from the oncoming train has been dug up and sent to Wenzhou for analysis.

More information  on the technical reasons for the train crash is slowly coming to light.  Five days after the accident, government officials have stated that a signal which would have stopped the moving train failed to turn red and the error wasn’t noticed by workers.  There is talk about system design errors and inadequate training.

It’s unlikely that all the details will ever be public knowledge, but there is one takeaway from this accident that can be applied to any organization in any industry that performs investigations – the importance of transparency. The Chinese government spent over $100 billion in 2010 expanding the high speed rail system, but if people don’t feel safe riding the rail system it won’t be money well spent.  Customers need to feel that an adequate investigation has been performed following an accident or they won’t use the products produced by the company.

To view an initial Cause Map built for this train accident, please click on “Download PDF” above.  A Cause Map is an intuitive, visual method of performing a root cause analysis.  One of the benefits of a Cause Map is that it’s easily understood and can help improve the transparency of an investigation for all involved.