D.C. Metro Train Collision

Download PDFBy ThinkReliability Staff

On June 22, 2009, the Washington, D.C. area suffered its first fatal Metro train crash since 1982.  A transit train smashed into another train that was stopped on the tracks.  There has been an apparent increase in crashes in large city’s transit systems over the last several months, causing some to question whether enough is being done to ensure an attitude of safety.  Robert Lauby, a former NTSB investigator, said:

“Just because you had them doesn’t mean there’s a specific issue that caused them.”

Actually, that’s exactly what it means.  If something happens (an effect), there has to be a cause.  Usually there’s more than one cause.  We can look at this incident in a root cause analysis to determine what some of the causes were.  A thorough root cause analysis built as a Cause Map can capture all of the causes in a simple, intuitive format that fits on one page.

The official investigation is still in its infant stages, but we can still put together a pretty thorough Cause Map.  (See the Cause Map by clicking on “Download PDF” above.)  We can add more detail to this Cause Map as the investigation continues. As with any investigation the level of detail in the analysis is based on the impact of the incident on the organization’s overall goals.

First we define the problem.  Here, it’s that two trains crashed.  We also enter the other identifying information (date, location and process.)  Then we frame the problem with respect to the impacts to the goals.  Here, the safety goal was impacted because at least 9 people were killed and at least 76 were injured.  The material goal was impacted because of severe damage to the trains.

Next, we do the root cause analysis.  We begin with the impacted goals and ask “why” questions to find all the causes of the incident.  People were killed and injured because of the damage to the trains.  The trains were damaged because of a train, which was moving at a “considerable speed”  rear-ending a stopped train, and because of the  inadequate crashworthiness of the moving train.

The train was not adequately crashworthy because it was old, and not replaced (despite an NTSB recommendation to replace or retrofit the older cars to increase safety in a crash).  Why weren’t they replaced?  We don’t know yet, but the NTSB will be talking to Metro’s administration to find out.

The two trains collided because the train that was rear-ended was stopped on the tracks, waiting for another train to move.  The train that struck it did not stop or slow down.  The striking train was not equipped with a data recorder and the operator was killed in the incident, so we don’t have a very good idea of what happened.  But we can come up with some theories and then refine or reject them as evidence permits.  Since the train didn’t stop, it’s either because there was no attempt to stop, or the braking system malfunctioned.  From the information we have available, it appears that a train would not attempt to stop if the operator was unaware of the train, because she couldn’t see it and because the sensor system was not working properly,  AND if the mechanical override system was not working.  The sensor system not working might cause the mechanical override system to not work, OR the system could have been overridden by either the dispatcher or the operator.  (Apparently having the train in manual may turn off the mechanical override.)

We can continue to add to our root cause analysis as we get more information on the accident.

Preventing Runway Incursions at LAX

Download PDFBy ThinkReliability Staff

Enterprising companies know that finding new, effective solutions to problems makes good business sense.  Finding new solutions can be the difficult part.  A root cause analysis can help find new, effective solutions.  To demonstrate this capability, we’ll look at the problem of runway incursions at Los Angeles International Airport (LAX).  In 2007, there were 21 incursions at LAX.  Perhaps the problem was discussed, and it was determined that one of the causes of these incursions was that the taxiways intersected the runways.  This is shown below in a Cause Map, or visual root cause analysis.

Runway CM1

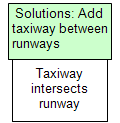
A potential solution, then, is to install a taxiway between the runways, so that they don’t intersect.

Runway CM2

This solution has been implemented at LAX, with the result of runway incursions dropping to 5 so far this year.  However, LAX officials would like that number to fall even further.  So they started looking for new solutions.  Finding new solutions may mean adding more detail to the Cause Map.  For example, what if we add another cause for runway incursions?

Runway CM 3

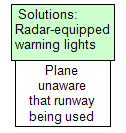
This gives us another cause that we can try to “solve”.  Here, the solution being implemented at LAX is radar-equipped warning lights.  Essentially, if the system senses a plane or vehicle that could lead to a potential collision on a runway or taxiway, the runway lights turn red.  If not, they are green.  The plane still has to request clearance from traffic control, but it adds another layer of protection.

Runway CM 4

Officials at LAX hope this will continue to decrease the number of incursions at LAX.  If not, the root cause analysis can be built into even more detail, and more solutions can be found.

Loss of submarine KURSK

Download PDFBy ThinkReliability Staff

On August 12, 2000, a torpedo exploded on KURSK, leading to the eventual loss of the submarine and all on board.  We can demonstrate the causes of the KURSK tragedy by performing a visual root cause analysis, or Cause Map.  A thorough root cause analysis built as a Cause Map can capture all of the causes in a simple, intuitive format that fits on one page. First we define the problem(s).  Here, the problems include a torpedo explosion and submarine sinking.  This is the “what”.  The initial explosion on KURSK ocurred at 11:28 a.m. on August 12, 2000.  This is the “when”.  The KURSK (a Russian attack submarine) was in the southern Barents Sea, performing a torpedo firing drill.   This is the “where”.  We’ll also frame this incident with respect to the impact to the goals.  The safety goal was impacted because all 118 sailors on board were killed.   The materials goal was impacted because of the loss of the submarine.  There are other goals that were impacted, but for our basic analysis, we will stop here.

Next we perform the analysis portion of the root cause analysis. We can begin by using the “5-Whys” technique.  We start with the impact to the safety goal, and ask “why” 5 times.  For example: Why was the safety goal impacted?  Because 118 sailors died.  Why?  Because of the explosion of missiles and torpedo fuel.  Why did the missiles and torpedo fuel explode?   Because of the impact when the submarine hit the bottom of the ocean.  Why did the submarine sink? A torpedo exploded, breaching the hull.  Why?   A fuel leak on the torpedo.  The resulting Cause Map is shown on the downloadable PDF.  Though the resulting Cause Map is accurate, it’s not complete.

We can add additional causes to make our map more complete.  For example, although 95 sailors were killed directly by the explosion, the remaining 23 sailors actually died from carbon monoxide poisoning because they were trapped in the aft compartment due to the submarine sinking.

A higher detail Cause Map is also shown on the downloadable PDF.  Even more detail can be added as the root cause analysis investigation continues.  The level of detail in a Cause Map is determined by the impact to the organization’s goals.  Because of the tragically high number of deaths in this incident, it will be worked to a very high detail.  The highest detail level Cause Map has more than 150 causes.

Eschede Train Derailment

Download PDFBy ThinkReliability Staff

June 3, 1998, a train derailed and crashed into a bridge near Eschede, Germany, killing 101 people, including 2 engineers who had been working on the bridge.  A thorough root cause analysis built as a Cause Map can capture all of the causes of this tragedy in a simple, intuitive format that fits on one page.We can begin our analysis with the “5 Whys” technique, asking “Why” 5 times.  1) Why did the train crash into a bridge?  It derailed.  2) Why did it derail?  A tire embedded in the railcar changed the switch.  3) Why was the tire embedded?  It had come off the wheel.  4) Why did the tire come off the wheel?  The tire broke.  5) Why did the tire break?  Fatigue cracking.  This forms the beginning of a root cause analysis investigation.

As we continue the investigation, we can create a more detailed root cause analysis.  We begin by defining the problem in terms of the impacts to the organization’s goals.  The safety goal was impacted because of the 101 deaths, and 88 injuries.  Also, the train suffered serious damage, resulting in an impact to the materials/labor cost goal.  These impacts to the goals form the basis for our Cause Map.

eschede-thumbnailThe goals were all impacted due to the destruction of the rear railcars.  This occurred because the train crashed into a bridge at 200 km/hour.  The train was not stopped or slowed because of company policy to investigate an  issue first.  The train crashed into the bridge because it had derailed because a tire embedded in the railcar collided with a switch guard rail.  The tire became embedded because it broke, due to fatigue cracking from wear and inadequate inspections, and an insufficient design.  The design was insufficient because the prototypes were not physically tested and dynamic repetitive forces were not considered in the modeling.

Even more detail can be added to this Cause Map as the analysis continues. As with any investigation the level of detail in the analysis is based on the impact of the incident on the organization’s overall goals.  Once the Cause Map is completed to the desired level of detail, solutions can be found for any of the cause boxes.  Solutions are then shown with the cause they control.