Is Lard The Misunderstood Fat?

By Kim Smiley

For many of us the word lard instantly invokes images of clogged arteries and heart disease.  A hundred years ago, lard was a staple item in nearly every pantry, but today few of us can imagine cooking with such an unhealthy substance.

But what if lard isn’t as bad as the collective knee jerk reaction would lead us to believe?

While lard is certainly not olive oil, the reality is that lard is actually a relatively healthy option when a solid fat is needed.  This is true because most of the fat in lard is monounsaturated fat, which is healthier than saturated fat.  The fat in lard is 40 percent saturated compared with 60 percent saturated fat in butter.   The partially hydrogenated fats found in vegetable shortening are now considered to be the least healthy option.  While Crisco no longer contains trans-fats, lard has always been naturally trans-fat free.

So how did lard get such a bad reputation?  A Cause Map, a visual, intuitive root cause analysis format, can be built to explore this question.  To view a high level Cause Map of this example, click on “Download PDF” above.

A recent article from National Public Radio tried to answer the question – who killed lard?  The article claimed that a number of factors contributed to the fall of lard’s popularity.  The public became uneasy about the pork industry after the publication of Upton Sinclair’s The Jungle.  Included in the book was a disgusting scene that depicted workers falling into vats of lard and being sold along with it for human consumption which understandably cooled the public’s appetite for lard.

A second major factor was that an alternative fat product became available that offered an option to a public queasy about the pork industry.  Crisco came on the market, armed with a massive marketing campaign, offering a fat option that wasn’t associated with the pork industry.  The creation of Crisco was possible because of the invention of hydrogenation and a surplus of cottonseed oil.  The oil had previously been used to manufacture candles, but the invention of the light bulb had dimmed the demand.

At about the same time Crisco was hitting shelves, scientist began asking questions about the saturated fat in lard.  Ironically the bad publicity about the health impacts of trans-fats (which were in shortening at the time) was years away, but the early findings that linked saturated fat to heart disease were another strike against the popularity of lard.

Today, lard is making a comeback with foodies, but it still isn’t widely used and it is difficult to find in stores.  Only time will tell if lard will once again became a popular pantry staple.

Deadly Stage Collapse at State Fair

By Kim Smiley

On August 13, 2011, a stage at the Indiana State fair collapsed, killing seven and injuring dozens more.  The accident occurred just before 9 pm as a crowd waited to watch the popular country band Sugarland perform.

Why did the stage collapse?  What caused this tragic accident to occur?

This incident can be analyzed by building a Cause Map, an intuitive, visual format for performing a root cause analysis.  The first step when beginning a Cause Map is to determine what goals have been impacted.  In this example, the focus will be on the safety goal since there were fatalities and many injuries.  Once the impact is determined, the Cause Map is built by asking “why” questions to determine what causes contributed to the accident.

In this example, people were killed and injured because they were near the stage and the stage collapsed.  They were near the stage because they were waiting for a concert and the area had not been evacuated.  The area had not been evacuated because the decision to evacuate wasn’t made in time.  The decision didn’t happen in a timely manner because it wasn’t clear who had the authority to make the decision because there was not an adequate emergency plan in place.  The bad weather wasn’t a surprise.  The storm was being monitored and the National Weather Service had issued a warning, but the decision to evacuate wasn’t made until too late to prevent the tragedy.

Recently findings by investigators determined that the stage collapsed because it wasn’t up to code.  The structure was required to be able to withstand winds up to 68 mph, but the stage collapsed at winds below this limit.  Investigators determined that the lateral supports were inadequate and the stage wasn’t strong enough to stand up to the wind.  The stage also wasn’t inspected because it was a temporary structure and they are not required to be inspected.

On Tuesday, (April 17, 2012)  Indiana Governor Daniels reported that he has ordered temporary outdoor structures to be inspected by the Indiana Department of Homeland Security to help prevent a similar accident in the future.

To view a high level Cause Map of this incident, click “Download PDF” above.

Cleaning Up Aerosols May have Fueled Hurricanes

By Kim Smiley

A recent study by Britain’s Met Office weather service found that reducing pollutants in the atmosphere has had an unintended consequence, an increase in intense hurricane activity in North America.

A Cause Map, a visual root cause analysis, can be a helpful tool to understand this type of issue.  A Cause Map shows the cause and effect relationships between the different causes that contribute to an issue and can illustrate the potential consequence of changing one cause.

In this example, the problem is that hurricane activity has been increasing in the Atlantic Ocean.  Previous studies have found a link between a rise in ocean temperature and the increase in hurricane activity. Higher temperatures result in more intense hurricanes because there is more water vapor in the air because more water evaporates at higher temperatures.  More heat is released as the water vapor condenses into rain and this heat fuels the hurricane.

The surface temperature of the Atlantic Ocean has increased a small amount, about half a degree Celsius since 1970.  Scientists are not in agreement about the cause of this temperature increase.  Some people believe that the change is simply part of the natural long term variability of ocean temperatures.  Other scientists believe that global warming has caused the higher temperatures.  This new study adds a new dimension to the discussion.

The Met office study found that the reduction in aerosol pollutants in the air caused the rise in the ocean temperature.  Aerosols play a role because they affect the way clouds form.  More aerosols result in brighter, longer lasting clouds so reducing the aerosols in the atmosphere means that there will be fewer clouds over the ocean.  Fewer clouds mean that less sunlight is reflected away.  All this means that more sunlight will hit the ocean, increasing temperatures.

Fewer aerosols are in the environment because they cause acid rain and legislation was passed that limits how much can be released into the environment.

This issue is further complicated when the weather pattern is viewed on a global scale.  When the ocean temperature is cooler, there is less hurricane activity bombarding the United States, but then there are severe droughts in Africa.  Additional studies will be needed to confirm the findings on the effects of aerosol pollutants, but this new information is an interesting piece of the climate puzzle.

Siberian Plane Crash

By ThinkReliability Staff

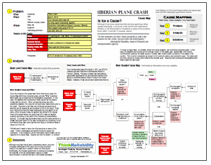
Four minutes after take-off on April 1, 2011, an ATR-72 crashed just past Roshchino International Airport in Tyumen, Siberia.  This type of plane has had previous issues with dealing with ice, and has been banned from flying in conditions likely to result in icing in the United States.  However, it has not yet been determined that ice was related to the crash.

To begin a Cause Map – an intuitive, visual root cause analysis – we look at the impacted goals.  In this case, the fatalities and injuries are the primary impact, to the safety goal.  Additionally, this incident, combined with previous air safety issues in Russia (such as the September 2011 crash that killed a Russian hockey team), have eroded public confidence in air safety in the country.  This could be considered an impact to the customer service and production goal.  The plane split into three pieces on impact, which affects the property goal.   Searches and subsequent investigations will likely impact the labor goal.

Once the impacts to the goals have been determined, begin the Cause Map with these impacted goals, and ask “Why” questions.  More detail can be added as the investigation progresses.  In this case, the fatalities and injuries were likely caused by the plane’s impact with the ground.  Other mechanical issues are still a possibility; however, the crew did not report any malfunctions prior to the crash.  Disruption of air flow over the wings and jamming of ailerons can be caused by accumulation of ice on the plane.  It has been determined that there was inadequate de-icing agent on the plane, either because it was not applied (according to the deputy head of the airport where the plane took off) or was not applied properly (according to the head of the Russian air transportation agency).  It is known that the weather was cold (the plane landed in a snowy field) and that ATR-72s have trouble with icy conditions, to the point where they have been banned from flying in conditions likely to cause ice in the US.

Officials aren’t ready to name the icing issues as a cause of the crash.  Further investigation will determine which causes did contribute.  In the meantime, all the information that is known can be captured on a Cause Map.  Causes can then be added – or crossed off – as more information becomes available.

To view the Outline and Cause Map, please click “Download PDF” above.