Tag Archives: Process Map

Airplane Emergency Instructions: How do you make a work process clear?

By ThinkReliability Staff

What’s wrong with the process above?

This process provides instructions on how to remove the over-wing exit door on an airplane during an emergency.  However, imagine performing this process in an actual emergency.  During the time you spend opening the door, there will probably be people crowded behind you, frantic to get off the plane.  Step 4 indicates that after the door is detached from the plane wall, you should turn around and set the door (which is about 4’ by 2’ and can weigh more than 50 pounds) on the seats behind you.  In most cases, this will be impossible.  This is why emergency exit doors open towards the outside; in an emergency, a crush against the door will make opening the door IN impossible.

Even if it would be possible to place the door on the seat in the emergency exit row, it would likely reduce the safety of passengers attempting to exit.  As discussed, the exit door is fairly large and heavy.  It is likely to be displaced while passengers are exiting the airplane and may end up falling on a passenger, or blocking the exit path.

However, when this process was tested in training, it probably worked fine.  Why? Because it wasn’t an actual emergency, and there probably weren’t a plane full of passengers that really wanted to get out.  This is just another reason that procedures need to be tested in as close to actual situations as possible.  At the very least, any scenario under which the process is to be performed should be replicated as nearly as possible.

Now take a look at this procedure:

It’s slightly better, not telling us to put the removed door on the seat behind us, but instead it doesn’t tell us what to do with the door. Keep in mind that the person performing this procedure’s “training” likely consisted of a 30-second conversation with a flight attendant and that in all probability, the first time he or she will perform the task is during an emergency situation. When testing a procedure, it’s also helpful to have someone perform the procedure who is not familiar with it, with instructions to do only what the procedure says. In this case, that person would end up removing the door . . . and then potentially attempting to climb out of the exit with the door in their hands. This is also not a safe or efficient method of emergency escape.
This procedure provides a much better description of what should be done with the door. The picture clearly indicates that the door should be thrown out of the plane, where it is far less likely to block the exit or cause passenger injury.

The first two procedures were presumably clear to the person who created them.  But had they been tested by people with a variety of experience levels (particularly important in this case, because people of various experience levels may be required to open the doors in an emergency), the steps that really weren’t so clear may have been brought to light.

Reviewing procedures with a fresh eye (or asking someone to perform the procedure under safe conditions based only upon the written procedure) may help to identify steps that aren’t clear to everyone, even if they were to the writer.  This can improve both the safety, and the effectiveness, of any procedure used in your organization.

Avoiding Procedure Horrors in Your Little Shop

By ThinkReliability Staff

Are you singing “Suddenly Seymour”, yet?  In this blog, we take a look at the ever-so-interesting example of a Venus Flytrap.  These fascinating creatures have captured imaginations and inspired many science fiction books, movies and even a musical (Little Shop of Horrors).  When thinking about a Venus Flytrap, the “problem” really depends on the point of view   From the point of view of the fly, the problem is getting eaten for lunch.  From the point of view of the Venus Flytrap, the problem is how to catch its lunch.  Since it’s really only a problem for one of the parties, we will  focus on the question of how, and examine the Process Map as a best practice for documenting the how in your shop.

Process Maps are very useful tools.  Converting a written job procedure or word of mouth instructions into a picture or map can illuminate a complicated process and make it seem quite simple.  Asking how something happens, or how something gets done can provide valuable detail that can be useful for anyone attempting that task now and in the future.  The benefit can include preventing or minimizing incidents that often recur from lack of clarity in a procedure.

To start with, a very simple map can be created that shows the process of a Venus Flytrap eating a fly in 4 steps:  The fly lands in the trap, the trap closes, the plant eats the fly, and the trap opens again.  However, this ‘simple’ process is actually extremely complex.  In his recent article titled “Venus Flytraps Are Even Creepier Than We Thought” (The Atlantic, January 21 , 2016), Ed Yong outlines the process and intricacies of how the carnivorous plant works.  When the fly lands on the Flytrap’s bright red and enticing leaves, a complicated process of chemicals, electrical impulses and physics is kicked off… all with very delicate timing.  The Flytrap’s leaves are covered with sensitive hairs.  If the fly touches those hairs more than once in 20 seconds, it begins a process ensuring its own demise.  A well-timed increase in calcium ions and electrical impulses result in water flowing to the Flytrap’s leaves, causing them to change shape, trapping the fly inside.  At this point, the more the fly struggles, the more problems it creates for itself.  Further stimulating these hairs results in more calcium ions and more electrical impulses, this time resulting in the flow of hormones and digestive enzymes.  Over time, the leaves will create a hermetic seal and fill up with liquid, causing the fly to asphyxiate and die.  Next, the pH level of the fluid inside the trap drops to 2, and the digestive process begins in earnest.  Recent research suggests that chemical sensors on the Flytrap’s leaves can detect the level of digestion of the fly, stimulating the release of more digestive enzymes if needed, or causing the trap leaves to open back up.  The Flytrap is then ready to begin the process again.  As Charles Darwin said, “THIS plant, commonly called Venus’ fly-trap, from the rapidity and force of its movements, is one of the most wonderful in the world.”  (1875. Insectivorous Plants)

This Process Map, while detailed, could surely be broken down into further detail by a entomologist who deeply understands the intricate workings of a Venus Flytrap.  Fortunately for a baby Venus Flytrap, this process map is coded directly into its DNA, so it doesn’t have to rely on anything to know what to do.  Unfortunately for us, work-related tasks are rarely so instinctual.  We rely on job procedures, process maps and word of mouth to learn the best, safest way to get the job done. Ensuring consistency with that transfer of information is key to making sure that incidents and problems are avoided.  Problems that result from poorly defined procedures or work processes can go by many names: procedure not followed, human error, etc.  At the end of the day, the roots (pun intended) of many of these problems are poorly articulated or poorly communicated work processes.  The simple tool of a process map can help minimize these problems by making the steps of the process clear and easy to understand.

Celebrating with a bit of bubbly? Read this first . . .

By ThinkReliability Staff

What better day than New Year’s Eve to pop open a bottle of champagne (or its non-French sibling, sparkling wine)? Great thought, but turns out there’s a right way to open a bottle of bubbly, and “pop” has nothing to do with it.

Your initial thought may be who cares? What possible difference could it make how I open a bottle? Well, assuming your goal is to celebrate an enjoyable evening with friends, family, or maybe a date, using an improper opening procedure could impact the safety goal, by injuring yourself or others. It can also affect your reputation by failing to impress those with whom you’ve chosen to celebrate (as well as anyone else in the vicinity). The lost champagne is an impact to the property goal, and the potential for clean-up impacts the labor goal (and is clearly not what you want to be spending your New Year’s Eve doing).

A study claims that 900,000 injuries per year result from champagne. Injuries typically result from corks hitting faces, especially eyes. The pressure inside a bottle of champagne can be as high as 90 pounds per square inch, resulting in a cork traveling at speeds of up to 50 miles an hour. Injuries resulting from slips on spilled champagne also fall into this category.

Both spills and flying corks can be prevented by using a proper procedure to open a bottle of champagne. The preparation starts far before the party does. The first step is to ensure that the champagne is cooled properly. This is not only for taste, but also for safety. Another study found that cooling the bottle to 39 degrees F (4 degrees C) reduces the speed at which the cork leaves the bottle. (The cork travels only 3/4 of the speed of that from a room temperature, or 64 degrees F, bottle.)

Once you’re ready to serve the champagne, grab the bottle, glasses, and a kitchen towel. Check to see if there’s a tab on the foil covering the neck. If not, you’ll also need a knife. (One thing you won’t need? A corkscrew.) Remove the foil from the neck, by pulling the tab if one is present or by cutting with a knife, and then peeling it off. From this point until you start pouring, keep the bottle pointed at a 45 degree angle, and away from people, breakable objects, walls and ceilings. Untwist the wire tab, or key, and remove the wire cage, and hold your thumb over the cork. Cover the cork and neck of the bottle with the kitchen towel, and grab both the towel and cork with one hand. With the other hand, gently and slowly twist the bottle until the cork slides out. (This will be not with a pop, but more of a whimper.) Do not shake the bottle!

Hold champagne flutes at an angle and pour champagne in on the side to preserve the bubbles. Repeat as necessary. If you’ll need to leave the location at which you are drinking, please do it as a passenger, or wait until you’ve sobered up. For an average person, that means waiting about an hour for every 5 ounces of wine/ champagne consumed. (The drink size of other kinds of alcohol is defined differently, and your weight will impact the time it takes for alcohol to leave your system.)

If you or someone else forgets these rules and ends up getting hit in or near the eye with a champagne cork, take a trip to the ophthalmologist right away. (Because it’s New Year’s Eve, you may have to hit the emergency room first.) Says ophthalmologist Andrew Iwach, MD, “The good news is that as long as we can see these patients in a timely fashion, then there’s so many things we can do to help these patients preserve their vision.”

To view a visual diagram of the proper champagne-opening procedure, click on “Download PDF” above.

1990 Cascading Long Distance Failure

By ThinkReliability Staff

On January 15, 1990, a cascading failure resulted in tens of thousands of people in the Northeast US without long distance service for up to 9 hours.  This resulted in over 50 million calls being blocked at an estimated loss of $60 M.  (Remember, there weren’t really any other ways to quickly connect outside of the immediate area at the time.)

We can examine this historical incident in a Cause Map, or visual root cause analysis, to demonstrate what went   wrong, and what was done to fix the problem.  First, we begin with the impact to the goals.  No impacts to the safety, environmental, or property goals were discussed in the resources I used, but it is possible they were impacted, so we’ll leave those as unknown.  The customer service and production goals were clearly impacted by the loss of service, which was considerable and estimated to cost $60 million, not including time for troubleshooting and repairs.

Asking “Why” questions allows development of the cause-and-effect relationships that led to the impacted goals.  In this case, the outage was due to a cascading switch failure: 114 switches crashed and rebooting over and over again.  The switches would crash upon receiving a message from its neighbor switches.  This message was meant to inform other switches that one switch was busy to ensure messages were routed elsewhere.  (A Process Map demonstrating how long distance calls were connected is included on the downloadable PDF.)  Unfortunately, instead of allowing the call to be redirected, the message caused a switch to crash.  This occurred when an errant line in the coding of the process allowed optional tasks to overwrite crucial communication data.  The error was included in a software upgrade designed to increase throughput of messages.

It’s not entirely clear how the error (one added line of code that would bring down a huge portion of the long distance network) was released.  The line appears to be added after testing was complete during a busy holiday season. That a line of code was added after testing seems to indicate that the release process wasn’t followed.

In this case, a solution needed to be found quickly. The upgraded software was pulled and replaced with the previous version.  Better testing was surely used in the future because a problem of this magnitude has rarely been seen.

To view the Outline, Cause Map and Process Map, please click “Download PDF” above.  Or click here to read more

Cleaning up Fukushima Daiichi

By ThinkReliability Staff

The nuclear power plants at Fukushima Daiichi were damaged beyond repair during the earthquake and subsequent tsunami on March 11, 2011.  (Read more about the issues that resulted in the damage in our previous blog.)  Release of radioactivity as a result of these issues is ongoing and will end only after the plants have been decommissioned.  Decommissioning the nuclear power plants at Fukushima Daiichi will be a difficult and time consuming process.  Not only the process but the equipment being used are essentially being developed on the fly for this particular purpose.

Past nuclear incidents offer no help.  The reactor at Chernobyl which exploded was entombed in concrete, not dismantled as is the plan for the reactors at Fukushima Daiichi.  The reactor at Three Mile Island which overheated was defueled, but the pressure vessel and buildings in that case were not damaged, meaning the cleanup was of an entirely different magnitude.  Lake Barrett, the site director during the decommissioning process at Three Mile Island and a consultant on the Fukushima Daiichi cleanup, says that nothing like Fukushima has ever happened before.

An additional challenge?  Though the reactors have been shut down since March 2011, the radiation levels remain too high for human access (and will be for some time).  All access, including for inspection, has to be done by robot.

The decommissioning process involves 5 basic steps (though the completion of them will take decades).

First, an inspection of the site must be completed using robots.  These inspection robots aren’t your run-of-the-mill Roombas.  Because of the steel and concrete structures involved with nuclear power, wireless communication is difficult.  One type of robot used to survey got stuck in reactor 2 after its cable was entangled and damaged.   The next generation of survey robots unspools cable, takes up slack when it changes direction and plugs itself in for a recharge.  This last one is particularly important: not only can humans not access the reactor building, they can’t handle the robots after they’ve been in there.  The new robots should be able to perform about 100 missions before component failure, pretty impressive for access in a site where the hourly radiation dose can be the same as a cleanup worker’s annual limit (54 millisieverts an hour).

Second, internal surfaces will be decontaminated.  This requires even more robots, with different specialties.  One type of robot will clear a path for another type, which will be outfitted with water and dry ice, to be blasted at surfaces in order to remove the outer level, and the radiation with it.  The robots will them vacuum up and remove the radioactive sludge from the building.  The resulting sludge will have to be stored, though the plan for the storage is not yet clear.

Third, spent fuel rods will be removed, further reducing the radiation within the buildings.  A shielded cask is lowered with a crane-like machine, which then packs the fuel assemblies into the cask.  The cask is then removed and transported to a common pool for storage.  (The fuel assemblies must remain in water due to the decay heat still being produced.)

Fourth, radioactive water must be contained.  An ongoing issue with the Fukushima Daiichi reactors is the flow of groundwater through contaminated buildings.  (Read more about the issues with water contamination in a previous blog.)  First, the flow of groundwater must be stopped.  The current plan is to freeze soil to create a wall of ice and put in a series of pumps to reroute the water.    Then, the leaks in the pressure vessels must be found and fixed.  If the leaks can’t be fixed, the entire system may be blocked off with concrete.

Another challenge is what to do with the radioactive water being collected.  So far, over 1,000 tanks have been installed.  But these tanks have had problems with leaks.    Public sentiment is against releasing the water into the ocean, though the contamination is low and of a form that poses a “negligible threat”.  The alternative would be using evaporation to dispose of the water over years, as was done after Three Mile Island.

Finally, the remaining damaged nuclear material must be removed.  More mapping is required, to determine the location of the melted fuel.  This fuel must then be broken up using long drills capable of withstanding the radiation that will still be present.  The debris will then be taken into more shielded casks to a storage facility, the location of which is yet to be determined.  The operator of the plant estimates this process will take at least 20 years.

To view the Process Map laid out visually, please click “Download PDF” above.  Or click here to read more.

The Salvage Process of Costa Concordia

By ThinkReliability Staff

On September 16, 2013, the fatally stricken Costa Concordia was lifted upright (known as “parbuckling”) after salvage operations that were the most expensive and involved the largest ship ever. The ship ran aground off the coast of Italy January 13, 2012 (see our previous blog about the causes of the ship running aground) and has been lying on its side for the 20 months since.

The ship grounding had immediate, catastrophic impacts, including the death of 32 people. However, it also had longer term impacts, mainly pollution from the fuel, sewage and other hazardous materials stored aboard the ship. It was determined that the best way to minimize the leakage from the ship would be to return it upright and tow it to port, where it the onboard waste could be emptied and disposed of, then the ship broken up for scrap.

Because a salvage operation of this magnitude (due to the size and location of the ship) had never been attempted, careful planning was necessary. Processes like this salvage operation can be described in a Process Map, which visually diagrams the steps that need to be taken for a process to be completed successfully. A Process Map differs from a Cause Map, which visually diagrams cause-and-effect relationships to show the causes that led to the impacts (such as the deaths and pollution). Whereas a Cause Map reads backwards in time (the impacted goals result from the causes, which generally must precede those impacts), a Process Map reads from left to right along with time. (Step 1 is to the left of, and must be performed before, Step 2.) In both cases, arrows indicate the direction of time.

Like a Cause Map, Process Maps can be built in varying levels of detail. In a complex process, many individual steps will consist of more detailed steps. Both a high level overview of a process, as a well as a more detailed breakdown, can be useful when developing a process. Processes can be used as part of the analysis step of an incident investigation – to show which steps in a process did not go well – or as part of the solutions – to show how a process developed as a solution should be implemented.

In the example of the salvaging of the Costa Concordia, we use the Process Map for the latter. The salvaging process is part of the solutions – how to remove the ship while minimizing further damage and pollution. This task was not easy – uprighting the ship (only the first step in the salvage process) took 19 hours, involved 500 crewmembers from 26 countries and cost nearly $800 million. Other options used for similar situations included blowing up the ship or taking it apart on-site. Because of the hazardous substances onboard – and the belief that two bodies are still trapped under or inside the ship – these options were considered unacceptable.

Instead, a detailed plan was developed to prepare for leakage with oil booms that held sponges and skirts, then installed an underwater platform and 12 turrets to aid in the parbuckling and hold the ship upright. The ship was winched upright using 36 cables and is being held steady on the platform with computer-controlled chains until Spring, when the ship will be floated off the platform and delivered to Sicily to be taken apart.

To view the Process Map in varying levels of detail, please click “Download PDF” above. Or, see the Cause Map about the grounding of the ship in our previous blog.

Delivering the Curiosity to Mars

By Kim Smiley

On August 6th, the Curiosity, NASA’s newest rover, safely landed on the surface of Mars.  The Curiosity is better equipped and larger than previous rovers, weighing about five times as much as the Spirit and Opportunity and carrying ten times the mass of scientific instruments. This extra weight meant that the previous methods used to deliver rovers to the Martian surface wouldn’t work and NASA had to design something that had never been tried before.

What NASA came up with was the concept of using a sky crane to hover over the surface of the planet while lowering the Curiosity to a soft landing.  This was a brand new design and the differences in atmosphere between earth and Mars meant it couldn’t be tested before it was launched into space.  There was only one chance to get it right.

When Curiosity, inside the Mars Science Laboratory (MSL) space probe, first hit the Mars atmosphere it was traveling approximately 13,200 miles per hour.  After friction had decreased the speed by about 90%, a massive parachute was deployed to farther slow the MSL.  The heatshield on the bottom was then released revealing the undercarriage of the Curiosity. The top of the probe, called the backshell, was released second along with the parachute.

This is the point when things start to resemble science fiction. Retro-grade rockets fired to slow down the machine inside the probe, known as the sky crane, until it hovered about 66 feet above the surface.  The sky crane then slowly lowered the rover using tethers until the rover was safely on the surface.

The whole process took about seven minutes.

In an amazing feat of engineering, the Curiosity was safely put on the Martian surface in the designated area.  So far the rover is functioning as designed and it is traveling the surface of another planet, transmitting data back to the earth.

Like all processes, the methods used to deliver the Curiosity can be built into a Process Map.  Process Maps can be built to any level of detail desired and used in a variety of ways.  A large Process Map could be built that included hundreds of boxes, documenting every detail of each component that needed to perform a task during the descent of the Curiosity for use by engineers working on the project or a higher level Process Map could be used to describe the process in general terms to give the public an overview of the procedure.

To view a high level Process Map showing how the Curiosity was delivered to the surface of Mars, click on “Download PDF” above.

Shuttle Launch May Be Delayed Again

By ThinkReliability Staff

NASA’s plan to launch Discovery on its final mission continues to face setbacks.  As discussed in last week’s blog, the launch of Discovery was delayed past the originally planned launch window that closed on November 5 as the result of four separate issues.

One of these issues was a crack in a stringer, one of the metal supports on the external fuel tank.  NASA engineers haven identified additional stringer cracks that must also be repaired prior to launch.  These cracks are typically fixed by cutting out the cracked metal and bolting in new pieces of aluminum called doublers because they are twice as thick as the original stringers. The foam insulation that covers the stringers must then be reapplied.  The foam needs four days to cure, which makes it difficult to perform repairs quickly.

Adding to the complexity of these repairs is the fact that this is the first time they have been attempted on the launch pad. Similar repairs have been made many times, but they were performed in the factory where the fuel tanks were built.

Yesterday, NASA stated that the earliest launch date would be the morning of December 3.  If Discovery isn’t ready by December 5, the launch window will close and the next opportunity to launch will be late February.

NASA has stated that as long as Discovery is launched during the early December window the overall schedule for the final shuttle missions shouldn’t be affected.  Currently, the Endeavor is scheduled to launch during the February window and it will have to be delayed if the launch of Discovery slips until February.

In a situation like this, NASA needs to focus on the technical issues involved in the repairs, but they also need to develop a work schedule that incorporates all the possible contingencies.  Just scheduling everything is no easy feat.  In additional to the schedule of the remaining shuttle flights, the timing of Discovery’s launch will affect the schedule of work at the International Space Station because Discovery’s mission includes delivering and installing a new module and delivering critical spare components.

When dealing with a complex process, it can help to build a Process Map to lay out all possible scenarios and ensure that resources are allocated in the most efficient way.  In the same way that a Cause Map can help the root cause analysis process run more smoothly and effectively, a Process Map that clearly lays out how a process should happen can help provide direction, especially during a work process with complicated choices and many possible contingencies.

How a Shuttle is Launched

By ThinkReliability Staff

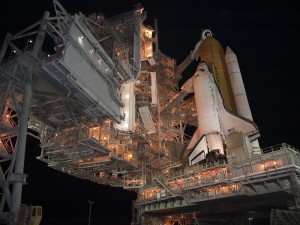
The Space Shuttle Discovery is expected to be launched November 4th, assuming all goes well.  But what does “all going well” entail?  Some things are obvious and well-known, such as the need to ensure that the weather is acceptable for launch.  However, with an operation as complex and risky as launching a shuttle, there are a lot of steps to make sure that the launch goes off smoothly.

To show the steps involved in shuttle launch preparation, we can prepare a Process Map.  Although a Process Map looks like a Cause Map, its purpose is to show the steps that must be accomplished, in order, for successful completion of a process.  We can begin a Process Map with only one box, the process that we’ll be detailing.  Here, it’s the “Launch Preparation Process”.  We break up the process into more detailed steps in order to provide more useful information about a process.  Here the information used was from Wired Magazine and NASA’s Launch Blog (where they’ll be providing up-to-date details as the launch process begins).

Here we break down the Shuttle Launch Process into 9 steps, though we could continue to add more detail until  we had hundreds of steps.  Some of the steps have been added (or updated) based on issues with previous missions.  For example, on Apollo I, oxygen on board caught fire during a test and killed the crew.  Now one of the first steps is an oxygen purge, where oxygen in the payload bay and aft compartments is replaced with nitrogen.  On Challenger, concerns about equipment integrity in extremely cold weather were not brought to higher ups.  Now there’s a Launch Readiness Check, where more than 20 representatives of contractor organizations and departments within NASA are asked to verify their readiness for launch.  This allows all contributors to have a say regarding the launch.  One of the last steps is the weather check we mentioned above.

Similar to the Launch Readiness Check, we can add additional detail to the Launch Status Check.  This step can be further broken down to show the checks of systems and positions that must be completed before the Launch Status step can be considered complete.  Each step within each Process Map shown here can be broken down into even more detail, depending on the complexity of the process and the need for a detailed Process Map.  In the case of an extremely complex process such as this one, there may be several versions of the Process Map, such as an overview of the entire process (like we’ve shown here) and a detailed version for each step of the Process to be provided to the personnel who are performing and overseeing that portion of the process.  As you can see a lot of planning and checking goes into the launch preparations!