Tag Archives: NASA

Extensive Contingency Plans Prevent Loss of Pluto Mission

By ThinkReliability Staff

Beginning July 14, 2015, the New Horizons probe started sending photos of Pluto back to earth, much to the delight of the world (and social media).  The New Horizons probe was launched more than 9 years ago (on January 19, 2006) – so long ago that when it left, Pluto was still considered a planet. (It’s been downgraded to dwarf planet now.)  A mission that long isn’t without a few bumps in the road.  Most notably, just ten days before New Horizons’ Pluto flyby, mission control lost contact with the probe.

Loss of communication with the New Horizons probe while it was nearly 3 billion miles away could have resulted in the loss of the mission.  However, because of contingency and troubleshooting plans built in to the design of the probe and the mission, communication was able to be restored, and the New Horizons probe continued on to Pluto.

The potential loss of a mission is a near miss. Analyzing near misses can provide important information and improvements for future issues and response.  In this case, the mission goal is impacted by the potential loss of the mission (near miss).  The labor and time goal are impacted by the time for response and repair.  Because of the distance between mission control on earth and the probe on its way to Pluto, the time required for troubleshooting was considerable owing mainly to the delay in communications that had to travel nearly 3 billion miles (a 9-hour round trip).

The potential loss of the mission was caused by the loss of communication between mission control and the probe.  Details on the error have not been released, but its description as a “hard to detect” error implies that it wasn’t noticed in testing prior to launch.  Because the particular command sequence that led to the loss of communication was not being repeated in the mission, once communication was restored there was no concern for a repeat of this issue.

Not all causes are negative.  In this case, the “loss of mission” became a “potential loss of mission” because communication with the probe was able to be restored.  This is due to the contingency and troubleshooting plans built in to the design of the mission.  After the error, the probe automatically switched to a backup computer, per contingency design.  Once communication was restored, the spacecraft automatically transmits data back to mission control to aid in troubleshooting.

Of the mission, Alice Bowman, the Missions Operation Manager says, “There’s nothing we could do but trust we’d prepared it well to set off on its journey on its own.”  Clearly, they did.

ISS Supply Mission Fails

By Kim Smiley

An unmanned Progress supply capsule failed to reach the International Space Station (ISS) and is expected to burn up during reentry in the atmosphere along with 3 tons of cargo.  Extra supplies are stored on the ISS and the astronauts onboard are in no immediate danger, but the failure of this supply mission is another in a string of high-profile issues with space technology.

This issue can be analyzed by building a Cause Map, a visual format of root cause analysis.  A Cause Map intuitively lays out the causes that contributed to an issue to show the cause-and-effect relationships.  To build a Cause Map, “why” questions are asked and the answers are documented on the Cause Map along with any relevant evidence to support the cause.

So why did the supply mission fail? The mission failed because the supply capsule was unable to dock with the ISS because mission control was unable to communicate with the spacecraft.  The Progress is an unmanned Russian expendable cargo  capsule that cannot safely dock with a space station without communication with mission control.  Mission control needs to be able to verify that all systems are functional after launch and needs a communication link to navigate the unmanned capsule through docking.

Images of the capsule showed that two of the five antennas failed to unfold leading to the communication issues.  Debris spotted around the capsule while it was in orbit indicates a possible explosion.  No further information has been released about what might have caused the explosion and it may be difficult to decisively determine the cause since the capsule will be destroyed in orbit.

The ISS recycles oxygen and water to an impressive degree and food is the first supply that would run out on the ISS, but NASA has stated that there are at least four months of food onboard at this time.  The failure of this mission may mean that the cargo for future missions will need to be altered to include more basic necessities and less scientific equipment, but astronaut safety is not a concern at this time. The failure of this mission does put additional pressure on the next resupply mission scheduled to be done by SpaceX in June in addition to creating more bad press for space programs that are already struggling during a turbulent time.

To view a intermediate Cause Map of this issue, click on “Download PDF” above.

Antares Cargo Rocket Explodes Seconds After Launch

By Kim Smiley

On October 28, 2014 an Antares cargo rocket bound for the International Space Station (ISS) catastrophically exploded seconds after launch.  The $200 million rocket was planned to be one of eight supply missions to the ISS that Orbital Sciences has a $1.9 billion contract to provide.  The investigation is still underway, but initial findings indicate that there may have been a problem with the engines, which were initially built in the 1960s and early 1970s by the Soviet space program.

Whenever NASA launches a rocket, it is observed by safety personnel with the ability to cause the rocket to self-destruct if it appears to be malfunctioning to minimize potential injuries and property damage. Reports by NASA have indicated that this flight-termination system was engaged shortly after liftoff in this case because the rocket malfunctioned shortly after takeoff.

Video of the launch and the subsequent explosion show the plume from one engine changing shape a second before the massive explosion.  The change in the plume has led to speculation that a turbopump failed shortly after liftoff and suggests that the engines were the source of the malfunction.  Investigators are currently reviewing the video of the launch, telemetry readings from the rocket, and studying the debris to learn as many details as possible about this failure.

The engines in question are NK-33 rocket engines that were initially built (not just designed, but actually manufactured) more than 4 decades ago. So how did engines from the Apollo era end up on a rocket decades later in 2014?  The one-word answer is money.

These engines were originally designed to support the Soviet space program which was disbanded in 1974.  For years, these engines were warehoused with no real purpose.  In 1990, these engines were sold to a company called Aerojet, reportedly for the bargain price of a cool million each.  The engines were refurbished and renamed Aerojet AJ-26s.  The cost of using these older engines was significantly less than developing a brand new rocket design.  In addition to being expensive, a new rocket design requires a significant time investment.  There are also limited alternatives available, partly due to NASA’s shrinking budget.

Orbital Sciences has announced that they will source a different engine and no longer use the AJ-26s, but it’s worth nothing that these rockets have been used successfully in recent years. They have launched Cygnus supply spacecraft three times without incident.

To view a high level Cause Map, a visual root cause analysis, of this incident, click on “Download PDF” above.

How a Toothbrush Helped Save the Space Station

By Kim Smiley

Using ingenuity reminiscent of Apollo 13, the crew on the International Space Station (ISS) recently found a way to fix an ailing electrical system using handmade tools made with an allen wrench, a wire brush, a bolt and a toothbrush.

The events that led to this dramatic repair attempt can be built into a Cause Map, a visual root cause analysis to help illustrate the causes that contributed to the problem. In this example, the problem was an issue with the electrical system on the space station.  Electrical issues can obviously quickly become dangerous on a space station because the life support systems need electricity to function. The impacts to the schedule and potential issues with accomplishing all the mission goals are also worth considering.

In order to fix the problem, astronauts needed to replace a failed Main Bus Switching Unit, a component that is responsible for collecting and distributing power from the solar arrays.  The ISS has four Main Bus Switching Units and each serves two of the eight solar arrays so the loss of a one of the units significantly impacts power supply.

The units are located outside of the space station and the plan was to replace the malfunctioning unit during a spacewalk, but the two astronauts doing the work ran into a problem.  An accumulation of metal shavings caused a bolt to stick, preventing installation of the new unit.  The astronauts needed to find a way to remove the metal shavings, but none of the tools they had taken on the spacewalk could get the job done.

The nearest hardware store was over 200 miles of atmosphere away and the options were limited, but the crew found an elegantly simple solution to the problem.  They created a cleaning tool out of items onboard the space station, including a $3 toothbrush.  An extra space walk was planned, the metal shavings were cleared and the new Main Bus Switching Unit was successful installed.  A cheap toothbrush taped to a metal handle had helped fix a $100 billion space station.

And if you’re wondering which Astronaut drew the short end of the oral hygiene stick, don’t worry the tooth brush was a spare.

To view a high level Cause Map of this issue, click on “Download PDF” above.

Delivering the Curiosity to Mars

By Kim Smiley

On August 6th, the Curiosity, NASA’s newest rover, safely landed on the surface of Mars.  The Curiosity is better equipped and larger than previous rovers, weighing about five times as much as the Spirit and Opportunity and carrying ten times the mass of scientific instruments. This extra weight meant that the previous methods used to deliver rovers to the Martian surface wouldn’t work and NASA had to design something that had never been tried before.

What NASA came up with was the concept of using a sky crane to hover over the surface of the planet while lowering the Curiosity to a soft landing.  This was a brand new design and the differences in atmosphere between earth and Mars meant it couldn’t be tested before it was launched into space.  There was only one chance to get it right.

When Curiosity, inside the Mars Science Laboratory (MSL) space probe, first hit the Mars atmosphere it was traveling approximately 13,200 miles per hour.  After friction had decreased the speed by about 90%, a massive parachute was deployed to farther slow the MSL.  The heatshield on the bottom was then released revealing the undercarriage of the Curiosity. The top of the probe, called the backshell, was released second along with the parachute.

This is the point when things start to resemble science fiction. Retro-grade rockets fired to slow down the machine inside the probe, known as the sky crane, until it hovered about 66 feet above the surface.  The sky crane then slowly lowered the rover using tethers until the rover was safely on the surface.

The whole process took about seven minutes.

In an amazing feat of engineering, the Curiosity was safely put on the Martian surface in the designated area.  So far the rover is functioning as designed and it is traveling the surface of another planet, transmitting data back to the earth.

Like all processes, the methods used to deliver the Curiosity can be built into a Process Map.  Process Maps can be built to any level of detail desired and used in a variety of ways.  A large Process Map could be built that included hundreds of boxes, documenting every detail of each component that needed to perform a task during the descent of the Curiosity for use by engineers working on the project or a higher level Process Map could be used to describe the process in general terms to give the public an overview of the procedure.

To view a high level Process Map showing how the Curiosity was delivered to the surface of Mars, click on “Download PDF” above.

Potential Power of Solar Flares

By Kim Smiley

The largest solar flare in recorded history occurred on September 1, 1859.  As the energy released from the sun hit the earth’s atmosphere, the skies erupted in a rainbow of colored auroras that were visible as far south as Jamaica and Hawaii.  The most alarming consequences of this “Carrington Event” (named for solar astronomer Richard Carrington who witnessed it) were its effect on the telegraph system. Operators were shocked and telegraph paper caught fire.

No solar flares approaching the magnitude of the Carrington Event have occurred since, but the question must be asked – What if a similarly sized solar flare happened today?

There is some debate on how severe the consequences would be, but the bottom line is that modern technology would be significantly impacted by a large solar flare.  When large numbers of charged particles bombard the earth’s atmosphere (as occurs during a large solar flare), the earth’s magnetic field is deformed.  A changing magnetic field will induce current in wires that are inside it resulting in large currents in electrical components within the earth’s atmosphere during a solar fare.

Satellites would likely malfunction, taking with them wireless communication, GPS capabilities and other technologies.  This would severely impact the modern world, but the largest impact would likely be to the power grid.  There is debate on how long power would be out and how severe the damage is, but it is clear that solar flares have the ability to significantly damage the power grid.  Solar flares much smaller than the Carrington Event have caused blackouts, but power was returned relatively quickly.  One of the more impressive of these examples occurred in 1989 when the entire province of Quebec lost power for about 12 hours. (Click here to read more.)

NASA works to predict and monitor sun activity so that preventive actions can be taken to help minimize damage if a large solar flare occurs.  For example, portions of the power grid could be shut down to help protect against overheating.  Scientists continue to study the issue, working to improve predictions for sun flare activity and learn how to better protect technology from them.  Click the “Download PDF” button above to view a high level Cause Map, a visual root cause analysis, built for this issue.

More information can be found in a report by the National Academy of Sciences, Severe Space Weather Events–Understanding Societal and Economic Impacts and the NASA website.

Shuttle Launch May Be Delayed Again

By ThinkReliability Staff

NASA’s plan to launch Discovery on its final mission continues to face setbacks.  As discussed in last week’s blog, the launch of Discovery was delayed past the originally planned launch window that closed on November 5 as the result of four separate issues.

One of these issues was a crack in a stringer, one of the metal supports on the external fuel tank.  NASA engineers haven identified additional stringer cracks that must also be repaired prior to launch.  These cracks are typically fixed by cutting out the cracked metal and bolting in new pieces of aluminum called doublers because they are twice as thick as the original stringers. The foam insulation that covers the stringers must then be reapplied.  The foam needs four days to cure, which makes it difficult to perform repairs quickly.

Adding to the complexity of these repairs is the fact that this is the first time they have been attempted on the launch pad. Similar repairs have been made many times, but they were performed in the factory where the fuel tanks were built.

Yesterday, NASA stated that the earliest launch date would be the morning of December 3.  If Discovery isn’t ready by December 5, the launch window will close and the next opportunity to launch will be late February.

NASA has stated that as long as Discovery is launched during the early December window the overall schedule for the final shuttle missions shouldn’t be affected.  Currently, the Endeavor is scheduled to launch during the February window and it will have to be delayed if the launch of Discovery slips until February.

In a situation like this, NASA needs to focus on the technical issues involved in the repairs, but they also need to develop a work schedule that incorporates all the possible contingencies.  Just scheduling everything is no easy feat.  In additional to the schedule of the remaining shuttle flights, the timing of Discovery’s launch will affect the schedule of work at the International Space Station because Discovery’s mission includes delivering and installing a new module and delivering critical spare components.

When dealing with a complex process, it can help to build a Process Map to lay out all possible scenarios and ensure that resources are allocated in the most efficient way.  In the same way that a Cause Map can help the root cause analysis process run more smoothly and effectively, a Process Map that clearly lays out how a process should happen can help provide direction, especially during a work process with complicated choices and many possible contingencies.

Space Shuttle Launch Delayed

By ThinkReliability Staff

Launching a space shuttle is a complicated process (as we discussed in last week’s blog).  Not only is the launching process complex, finding an acceptable date for launch is also complex.  This was demonstrated this week as the shuttle launch was delayed four times, for four separate issues and now will not be able to happen until the end of the month, at the earliest.

There are discrete windows during which a launch  to the International Space Station (which is the destination of this mission) can occur.  At some times, the solar angles at the International Space Station would result in the shuttle overheating while it was docked at the Space Station.  The launch windows are open only when the angles are such that the overheating will not occur.

The previous launch window was open until November 5th.  The launch was delayed November 1st for helium and nitrogen leaks, November 2nd for a circuit glitch, November 4th for weather, and November 5th for a gaseous hydrogen leak.  After the November 5th delay, crews discovered a  crack in the insulating foam, necessitating repairs before the launch.  These delays pushed the shuttle launch out of the available November launch window.  The next launch window is from December 1st through 5th, which gives the shuttle experts slightly less than a month to prepare for launch, or the mission may be delayed until next year.

Although not a lot of information has been released about the specific issues that have delayed the launches, we can put what we do know into a Cause Map.  A thorough root cause analysis built as a Cause Map can capture all of the causes in a simple, intuitive format that fits on one page.  Once more information is released about the specifics of the issues that delayed the launch, more detail can easily be added to the Cause Map to capture all the causes for the delay.  Additionally, the timeline can be updated to reflect the date of the eventual launch.

To view the problem outline, Cause Map, and launch timeline, please click on “Download PDF” above.

How a Shuttle is Launched

By ThinkReliability Staff

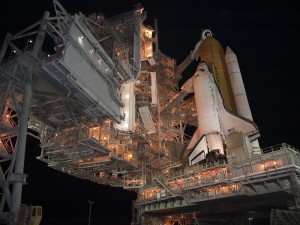
The Space Shuttle Discovery is expected to be launched November 4th, assuming all goes well.  But what does “all going well” entail?  Some things are obvious and well-known, such as the need to ensure that the weather is acceptable for launch.  However, with an operation as complex and risky as launching a shuttle, there are a lot of steps to make sure that the launch goes off smoothly.

To show the steps involved in shuttle launch preparation, we can prepare a Process Map.  Although a Process Map looks like a Cause Map, its purpose is to show the steps that must be accomplished, in order, for successful completion of a process.  We can begin a Process Map with only one box, the process that we’ll be detailing.  Here, it’s the “Launch Preparation Process”.  We break up the process into more detailed steps in order to provide more useful information about a process.  Here the information used was from Wired Magazine and NASA’s Launch Blog (where they’ll be providing up-to-date details as the launch process begins).

Here we break down the Shuttle Launch Process into 9 steps, though we could continue to add more detail until  we had hundreds of steps.  Some of the steps have been added (or updated) based on issues with previous missions.  For example, on Apollo I, oxygen on board caught fire during a test and killed the crew.  Now one of the first steps is an oxygen purge, where oxygen in the payload bay and aft compartments is replaced with nitrogen.  On Challenger, concerns about equipment integrity in extremely cold weather were not brought to higher ups.  Now there’s a Launch Readiness Check, where more than 20 representatives of contractor organizations and departments within NASA are asked to verify their readiness for launch.  This allows all contributors to have a say regarding the launch.  One of the last steps is the weather check we mentioned above.

Similar to the Launch Readiness Check, we can add additional detail to the Launch Status Check.  This step can be further broken down to show the checks of systems and positions that must be completed before the Launch Status step can be considered complete.  Each step within each Process Map shown here can be broken down into even more detail, depending on the complexity of the process and the need for a detailed Process Map.  In the case of an extremely complex process such as this one, there may be several versions of the Process Map, such as an overview of the entire process (like we’ve shown here) and a detailed version for each step of the Process to be provided to the personnel who are performing and overseeing that portion of the process.  As you can see a lot of planning and checking goes into the launch preparations!

The Future of NASA

By Kim Smiley

A previous blog discussed a shortfall in the National Aeronautics and Space Agency (NASA) budget.  The lack of funding put NASA’s organization goals in jeopardy, including a planned return mission to the moon.  Then-President George W. Bush had tasked NASA to return to the moon five years ago and NASA has been working toward this goal since.

President Obama announced his vision for NASA during a speech Kennedy Space Center on April 15.  He canceled plans for a moon mission and redirected NASA to focus on sending astronauts to an asteroid and work toward an eventual Mars landing.  The proposed budget would boost NASA funding by six billion over the next five years.

President Obama’s plan calls for private companies to fly to the space station using their own rockets and ships, freeing up NASA resources for basic research and development of technologies for trips beyond earth’s orbit.  The final space shuttle mission is scheduled for September 2011 after which the US will depend entirely on Russia to carry astronauts to the space station until a replacement for the space shuttle is developed.  Additionally, the space station’s life would be extended by five years as part of the Obama plan.

The planning necessary to achieve a goal of this complexity is mind boggling.   There are many new technical issues to consider and brand new equipment will need to be designed.  There are many, many potential problems that could arise during this design process and mission.

Cause Mapping is often used to perform a root cause analysis of an incident that has occurred, but it can also be used to proactively approach a problem by building a map that captures failures that could happen.  Identifying potential problems before they happen would allow NASA to mitigate risks and allocate resources efficiently.

Cause Maps could be built to any level of detail that was deemed appropriate.  Cause Maps could be developed to capture all potential failure modes for something as small as a single component or for something as large the entire mission.