Tag Archives: Pipeline

Pipeline Spill in Alberta Threatens Drinking Water

by ThinkReliability Staff

A pipeline spill in Alberta, Canada of up to 480,000 litres was noticed on the evening of June 7, 2012.  Although pipelines are estimated to spill approximately 3.4 million litres a year, they are not frequently near populated areas or water sources.  However, due to the proximity of this spill to a drinking water source, there was the potential of impact to drinking water.  An issue of this magnitude, with this type of impact, is thoroughly investigated to reduce the risk of recurrence.  We can examine this issue in a visual root cause analysis performed as a Cause Map.

We begin with the impacts to the goals.  In this case, the safety goal is impacted because of the potential impact to drinking water.  The environmental goal is impacted because of the spill of sour crude oil.  The spill is impacting area residents in a variety of ways, which can be considered an impact to the customer service goal.  The production goal was impacted due to a 10-day shutdown of a portion of the pipeline.  The property goal is impacted by the damage to the pipeline, and the labor goal is impacted by the response and cleanup required.

Once we have developed the impacts to the goals, we can ask “Why” questions to develop the cause-and-effect relationships that resulted in those impacts.  The potential impact to drinking water resulted from the proximity of the spill to a drinking water source, because the spill was in a populated area, and the oil spill itself.  The oil spill resulted from damage to the pipeline and the time elapsed before the spill was stopped.  Because the longer a spill goes undetected, the more environmental impact it has, consideration of the adequacy of monitoring, inspection and testing must be considered to ensure that this risk is reduced.

Although the cause of the pipeline damage is still being investigated, causes that have resulted in prior pipeline damage include construction damage, internal corrosion, and external corrosion.  External corrosion can result from exposure to water, which in this case was impacted by recent flooding of the river and shallow burying of the pipe, as was typical with earlier installations.  The age of the pipe may have also impacted the internal corrosion, as the more time that pipe is exposed to hydrocarbons (which the pipe transmits) the more corrosion will occur.

Immediate solutions include isolating the damaged area with a valve.  Then repairs were made to the pipeline, and cleanup began.  Cleanup is expected to take most of the summer.  There have been calls for increased monitoring, testing, and inspection of the line, and with an incident of this type, that frequency should be examined to ensure it is appropriate to minimize these types of risk.

To view the Outline, Cause Map, and Solutions, please click “Download PDF” above.

Changing the Emergency Response Process

By ThinkReliability Staff

When Line 132 ruptured last September in the community of San Bruno, California, emergency personnel were quick to respond to the natural gas explosion.  The first fire truck was on scene within six minutes of the explosion.  What responders found was a chaotic scene, with multiple wounded and killed and swaths of the neighborhood in flames or simply flattened.  Little did they know that a large natural gas transmission line, feeding the spreading fire, was directly beneath them.  Emergency personnel did their best to clear homes and evacuate the wounded as the fire spread, but the confusion continued for nearly 90 minutes until the gas valves were shut off upstream from the fire.

The subsequent National Transportation Safety Board (NTSB) investigations focused on Pacific Gas and Electric (PG&E) processes following the accident, and found that PG&E was woefully unable to respond quickly to a crisis of this magnitude.  As a set of timelines show, emergency response personnel were already on scene long before PG&E was even aware that a pipeline rupture may be associated with a local fire.  PG&E apparently did not notice an alarm warning them of a pressure drop.  Control systems detected a severe pressure drop approximately four minutes after the disruption; however the PG&E gas control center, located in San Francisco, remained unaware of the explosion and fire until a PG&E dispatch center in Concord called them.  Off duty employees had called-in to the Concord dispatch center 7 and 11 minutes after the incident, alerting them of a large fire in San Bruno.  However it was not until the dispatch center called the gas control center 16 minutes after the explosion that gas control operators realized what was happening.  By this point emergency responders had already arrived at the scene, unaware of the large natural gas pipeline directly under the neighborhood.

What information did emergency responders have as they arrived on scene that day?  Although PG&E itself was aware of the likely service disruption, they failed to notify first responders of any potential danger in those critical minutes after the explosion.  Additionally according to NTSB testimony, the fire department was unaware of the large natural gas pipeline under the community.  Larger transmission pipelines have different operating characteristics than smaller distribution pipelines, including different recommended safety precautions and shut down times.  With a better awareness of the pipeline locations and associated dangers, emergency response personnel could have developed training and response procedures ahead of time for an explosion of this magnitude.  PG&E has since taken steps to enhance its partnership with first responders and other public safety organizations.  Clearly there are other steps that need to be taken as well.

When conducting an investigation, a timeline can be a helpful tool to organize information.  While straightforward to build, timelines can identify areas needing more research and aid in building a process map and a Cause Map.  Compare what happened at PG&E to what emergency responders were doing.  You’ll notice there was a significant delay at PG&E in recognizing there was a problem and then acting upon it.  It took nearly 90 minutes to close valves to shut transmission lines.  Changes must be made to speed up PG&E’s procedures in a crisis situation.

Likewise process maps are a useful tool for determining where a process can use improvement.  In the Current process map, it is noticeable that there are three parallel processes occurring, where information is not being shared in an efficient manner.  The PG&E Dispatch Center only shares information with the Emergency Dispatch Center after they have fully assessed the situation.  This information might come after the fact, as it did in San Bruno, or seriously delay an effective response by EMTs and firefighters.  Going one step further, trained emergency personnel might be able to check with local utilities if they have reason to suspect a natural gas pipeline is involved.  Simple procedural changes, such as who is notified and when, can have significant impacts.

It is important to note that the timeline helps create the most accurate “As Occurred” process map (called Current in this case).  Procedures can differ from actual processes, so it is important to document what actually happened, identify differences in what should have occurred, and figure out why it didn’t.  In this case, PG&E’s procedures were followed and need to be revised.

The NTSB recommendations will undoubtedly lead to multiple changes.  It is easy to focus on material solutions, which tend to be expensive to implement.  Some changes under consideration are the use of remote controlled valves and the replacement of aging pipes.  While there is no doubt that these changes need to happen, other changes can help in the meantime.  Process maps can help identify procedural changes which may be much less expensive, such a modifying notification procedures.

A detailed Cause Map built after the preliminary investigation shows what NTSB investigators believe led the natural gas leak.  More information on the NTSB investigation can be found here.

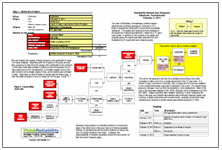
Residential Natural Gas Explosion

By ThinkReliability Staff

The town of Allentown, Pennsylvania suffered severe physical and emotional damage on February 9, 2011, when 5 people were killed and 8 homes were completely destroyed.  The deaths and destruction were believed to be caused by a natural gas explosion, fueled by a 12″ gas main break.  In addition to the impacts to the safety and property goals, the natural gas leak, extended fire, and time/labor by 53 responders also impacted goals.

We can analyze the causes of these impacts to the goals with a visual root cause analysis.  Beginning with the impacts to the goals, we ask why questions to determine the causes that contributed to the incidents.  In this case, there was a delay in putting out the fire because the fire had a heat source from the explosion, a constant oxygen source (the environment) and a steady supply of fuel, as the natural gas continued to leak.  There was no shut-off valve to quickly stop the flow of gas.  It took the utility company 5 hours to finally turn off the gas.  It took 12 more  hours before the fire was completely put out.

The fuel for the explosion and the fire is believed (according to the utility company) to have come from a break discovered in the 12″ gas main.  A 4′ section of pipe, removed on February 14th, is being sent for a forensic analysis to aid in determining what may have contributed to the crack.  It’s possible there was prior damage – such as that from weather or prior excavations.  Most of the pipe in the area was installed in the 1950s, although some is believed to be from the 1920s.  Budget shortfalls have delayed replacing, or even inspecting the lines in the area, and officials have warned that continuing financial issues may continue to delay inspections and improvements,  causing concern with many residents, who suffered a similar natural gas pipeline explosion in 1994.

Because implementation of potential solutions to improve the state of the utility lines in the area may be limited by available funding, it’s unclear what will be done to attempt to reduce the risk of a similar incident in the future.   However, the unacceptability of resident casualties should stir some action so that this doesn’t happen again.

Aging Natural Gas Pipeline Finally Fails

By ThinkReliability Staff

Few ever contemplate the complex system of utilities surrounding us.  The beauty of our modern standard of living is that usually there is little reason to think about those things.  Those rare cases where power isn’t available at the flip of a switch, or fresh water at the turn of a faucet usually make the local news.

Sadly, the community of San Bruno was faced with much more than simple inconvenience.  On September 9, 2010, an explosion ripped through the suburban community, ultimately killing 8 and destroying or damaging 100 homes.  The explosion was caused by a ruptured natural gas pipeline, and it appears that a slight increase in pipe pressure led to the final failure.  That change in pressure resulted from a glitch in maintenance procedures at a pipeline  terminal.  While ultimately that glitch may have been the “straw that broke the camel’s back”, it is clear from the Cause Map analysis that the straw pile was already fairly high.

Based on National Transportation Safety Board reports, both poor pipe construction and inadequate record-keeping played a major role in the failure.  The pipes, at or near their life expectancy, were already considered too thin by the 1950s’ standards when they were originally installed.  Furthermore improperly done welding made the pipes susceptible to corrosion.  Compounding these issues was the fact that PG&E, the utilities company responsible the pipeline, wasn’t even aware that the San Bruno pipeline had such extensive welding.  This matters because gas pressures are calculated based on a number of inputs, including the construction of the pipeline.  Even that slight increase in pressure proved to be more than the aging pipe could handle.

Natural gas pipelines are fairly extensive in the United States, and with suburban sprawl many communities live close to these pipelines.  In fact, many states have already taken steps to prevent similar events from occurring in their community.  Multiple utilities companies have been mandated to install newer pipelines, as in Texas and Washington.  Additionally, the federal government requires that newly constructed pipelines must be inspected by “smart pigs” – robots able to maintain and inspect pipeline systems.  However, modernizing this aging infrastructure will be expensive for many communities.

Perhaps there are easy, inexpensive interim solutions available.  The Cause Map analysis identifies all causes leading to the explosion, and then provides a systematic method for developing solutions.  Hopefully some of the solutions generated will prevent future disasters, like the one in San Bruno.