All posts by Angela Griffith

I lead comprehensive investigations by collecting and organizing all related information into a coherent record of the issue. Let me solve a problem for you!

Spill Kills Hundreds of Thousands of Marine Animals

By ThinkReliability Staff

A recent fish kill is estimated to have killed hundreds of thousands of marine life – fish, mollusks, and even endangered turtles – and the company responsible is facing lawsuits from nearby residents and businesses affected by the spill causing the kill.  A paper mill experienced problems with its wastewater treatment facility (the problems have not been described in the media), resulting in the untreated waste, known as “black liquor”, being dumped in the river.  The waste has been described as being “biological” not chemical in nature; however, the waste reduced the oxygen levels in the river which resulted in the kill.

Although it’s likely that a spill of any duration would have resulted in some marine life deaths, the large number of deaths in this case are related to the length of time of the spill.  It has been reported that the spill went on for four days before action was taken, or the state was notified.  The company involved says that action, and reporting to the state, are based on test results which take several days.

Obviously, something needs to be changed so that the company involved is able to determine that a spill is occurring before four days have passed.  However, whatever actions will be taken are as of yet unclear.  The plant will not be allowed to reopen until it meets certain conditions meant to protect the river.  Presumably one of those conditions will be figuring out a method to more quickly discover, mitigate, and report problems with the wastewater treatment facility.

In the meantime, the state has increased discharge from a nearby reservoir, which is raising the water levels in the river and improving the oxygen levels.  The company is assisting in the cleanup, which has involved removing lots of stinky dead fish from the river.  The cleanup will continue, and the river will be stocked with fish, to attempt to return the area to its conditions prior to the spill.

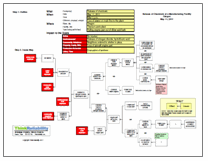
This incident can be recorded in a Cause Map, or a visual root cause analysis.  Basic information about the incident, as well as the impact to the organization’s goals, are captured in a Problem Outline.  The impacts to the goals (such as the environment goal was impacted due to the large numbers of marine life killed) are used to begin the Cause Map.  Then, by asking “Why” questions, causes can be added to the right.  As with any incident, the level of detail is dependent on the impact to the goals.

To view the Outline and Cause Map, click “Download PDF” above.

Release of Chemicals at a Manufacturing Facility

By ThinkReliability Staff

A recent issue at a parts plant in Oregon caused a release of hazardous chemicals which resulted in evacuation of the workers and in-home sheltering for neighbors of the plant.  Thanks to these precautions, nobody was injured.  However, attempts to stop the leak lasted for more than a day.  There were many contributors to the incident, which can be considered in a root cause analysis presented as a Cause Map.

To begin a Cause Map, first fill out the outline, containing basic information on the event and impacts to the goals.  Filling out the impacts to the goals is important not only because it provides a basis for the Cause Map, but because goals may have been impacted that are not immediately obvious.  For example, in this case a part was lost.

Once the outline is completed, the analysis (Cause Map) can begin.  Start with the impacts to the goals and ask why questions to complete the Cause Map.  For example, workers were evacuated because of the release of nitrogen dioxide and hydrofluoric acid.  The release occurred because the scrubber system was non-functional and a reaction was occurring that was producing nitrogen dioxide.  The scrubber system had been tripped due to a loss of power at the plant, believed to have been related to switch maintenance previously performed across the street.Normally, the switch could be reset, but the switch was located in a contaminated area that could only be accessed by an electrician – and there were no electricians who were certified to use the necessary protective gear.  The reaction that was producing the nitrogen oxide was caused when a titanium part was dipped into a dilute acid bath as part of the manufacturing process.

When the responders realized they could not reset the scrubber system switch, they decided to lift the part out of the acid bath, removing the reaction that was causing the bulk of the chemicals in the release.  However, the hoist switch was tripped by the same issue that tripped the scrubber system.  Although the switch was accessible, when it was flipped by firefighters, it didn’t reset the hoist, leaving the part in the acid bath, until it completely dissolved.

Although we’ve captured a lot of information in this Cause Map, subsequent investigations into the incident and the response raised some more issues that could be addressed in a one page Cause Map.  The detail provided on a Cause Map should be commensurate with the impacts to the goals.  In this case, although there were no injuries, because of the serious impact on the company’s production goals, as well as the impact to the neighboring community, all avenues for improvement should be explored.

To view the Outline and Cause Map, please click “Download PDF” above.  Or click here to read more.

Great Seattle Fire

By ThinkReliability Staff

On June 6, 1889, a cabinet-maker was heating glue over a gasoline fire.  At about 2:30 p.m., some of the glue boiled over and thus began the greatest fire in Seattle’s history.  We can look at the causes behind this fire in a visual root cause analysis, or Cause Map.  A thorough root cause analysis built as a Cause Map can capture all of the causes in a simple, intuitive format that fits on one page.

First we begin with the impacts to the goals.  There was one confirmed death resulting from the fire, and other fatalities resulting from the cleanup.  These are impacts to the safety goal.  The damage to the surrounding areas can be considered an impact to the environmental goal.  The fire-fighting efforts were insufficient; this can be considered an impact to the customer service goal.  Loss of water and electrical services is an impact to the production goal, the destruction of at least 25 city blocks is an impact to the property goal, and the rebuilding efforts are an impact to the labor goal.

Beginning with these impacted goals, we can lay out the causes of the fire.  The fire did so much damage because of the large area it covered.  It was able to spread over downtown Seattle because it continued to have the three elements required for fire – heat, fuel, and oxygen.  The heat was provided by the initial fire, oxygen by the atmosphere, and plenty of fuel with dry timber buildings.  The weather had been usually dry for the Pacific Northwest, and most of the downtown area had been built with cheap, abundant wood.

Additionally, fire fighters were unable to successfully douse the flames.  The all-volunteer fire department (most of whom reportedly quit after this fire) had insufficient water – hydrants were only placed at every other block, and the water pressure was unable to sustain multiple fire-fighting hoses.  Additionally, some of the water piping was also made of wood, and burned in the fire.  Firefighters attempted to pump water from the nearby bay, but their hoses were not long enough.

Before spreading across the city, the fire spread across the building where it began.  The fire began when glue being heated on a gasoline fire boiled over and lit.  The fire then began to burn the wood chips and turpentine spilled on the floor.  When the worker attempted to spray water at the fire, it only succeeded in spreading the lit turpentine, and thus the fire.  When firefighters arrived, the smoke was so thick that they were unable to find the source of the fire, and so it continued to burn.

The city of Seattle instituted many improvements as a result of this fire.  Wood burnings were banned in the district, and wood pipes were replaced.  A professional fire department was formed, and the city took over the distribution of water.  Possibly because of the vast improvements being made (and maybe because of the reported death of 1 million rats in the fire), the population of Seattle more than doubled in the year after the fire.

View the Cause Map by clicking on “Download PDF” above

Loss of Network Cloud Compute Service

By ThinkReliability Staff

On April 21, 2011, some of Amazon’s Elastic Compute Cloud (EC2) customers experienced issues when a combination of events led to their East region’s Elastic Block Store (EBS) being unable to process read or write operations.  This seriously impacted their customer service.  Massive efforts were undertaken and services, and  most data, was restored within 3 days.  Amazon has released their post-mortem analysis of these events.  Using the information they’ve provided, we can begin a visual root cause analysis, or Cause Map, laying out the event.

We begin with the affected goal.  Customer service was impacted because of the inability to process read or write operations.  This ability was lost due to a degraded EBS cluster.  (A cluster is a group of nodes, which are responsible for replicating data and processing read and write requests.)  The cluster was degraded by the failure of some nodes, and a high number of nodes searching for replicas.

At this point, we’ll look into the process to explain what’s going on.  When a user makes a request, a control plane accepts and processes that request to an EBS cluster. The cluster elects a node to be the primary replica of this data.  That node stores the data, and looks for other available nodes to make backup replicas.  If the node-to-node connection is lost, the primary replica searches for another node.  Once it has established connectivity with that node, the new node becomes another replica.  This process is continuous.

In this case, a higher number of nodes were searching for replicas because they lost connection to the other nodes.  Based on the process discussed above, the nodes then began a search for other nodes.  However, they were unable to find any other nodes because the network was unavailable (so the nodes could not communicate with each other).  The nodes had a long time-out period for searching for other nodes, so their search continued, and more nodes lost communication and began a search, increasing the volume.

The network communication was lost because data was shifted off the primary network.  This was caused by an error during a network configuration change to upgrade the capacity of the primary network.  The data should have been transferred to a redundant router on the primary network but was instead transferred to the secondary network.  The secondary network did not have sufficient capacity to handle all the data and so was unable to maintain connectivity.

In addition to a large number of nodes searching for other nodes, the EBS cluster was impacted by node failures.  Some nodes failed because of a race condition designed so that a node would fail when it attempted to process multiple concurrent requests for replicas.  These requests were caused by the situation above.  Additionally, the nodes failing led to more nodes losing their replicas, compounding the difficulty of recovering from this event.

Service is back to normal, and Amazon has made some changes to prevent this type of issue from reoccurring.   Immediately, the data was shifted back to the primary network and the error which caused the shifting was corrected.  Additional capacity was added to prevent the EBS cluster from being overwhelmed.  The retry logic which resulted in the nodes continuing to search for long periods of time has been modified, and the source of the race condition resulting in the failure of the nodes has been identified and repaired.

View the root cause analysis investigation of this event – including an outline, timeline, Cause Map, solutions and Process Map, by clicking “Download PDF” above.

Issues at Fukushima Daiichi Unit 3

By ThinkReliability Staff

There are many complex events occurring with some of Japan’s nuclear power plants as a result of the earthquake and tsunami on March 11, 2011.  Although the issues are still very much ongoing, it is possible to begin a root cause analysis of the events and issues.  In order to clearly show one issue, our analysis within this blog is limited to the issues affecting Fukushima Daiichi Unit 3.  This is not to minimize the issues occurring at the other plants and units, but rather to clearly demonstrate the cause-and-effect within one small piece of the overall picture.

The issues surrounding Unit 3 are extremely complex.  In events such as these, where many events contribute to the issues, it can be helpful to make a timeline of events.  A timeline of the events so far can be seen by clicking “Download PDF” above.  A timeline can not only help to clarify the order of contributing events, it can also help create the Cause Map, or visual root cause analysis.  To show how the events on the timeline fit into the Cause Map, some of the entries are denoted with numbers, which are matched to the same events on the Cause Map.  Notice that in general, because Cause Maps build from right to left with time, earlier entries are found to the right of newer events.  For example, the earthquake was the cause of the tsunami, so the earthquake is to the right of the tsunami on the map.  Many of the timeline events are causes, but some are also solutions.  For example, the venting of the reactor is a solution to the high pressure.  (It also becomes a cause on the map.)

A similar analysis could be put together for all of the units affected by the earthquake, tsunami and resulting events.  Parts of this cause map could be reused as many of the issues affecting the other plants and units are     similar to the analysis shown here. It would also be possible to build a larger Cause Map including all impacts from the earthquake.

The impact to goals needs to be determined prior to building a Cause Map. As a direct result of the events at Unit 3, 7 workers were injured.  This is an impact to the worker safety goal.  There is the potential for health effects to the population, which is an impact to the public safety goal.  The environmental goal was impacted due to the release of radioactivity into the environment.  The customer service goal was impacted due to evacuations and rolling blackouts, caused by the loss of electrical production capacity, which is an impact to the production goal.  The loss of capacity was caused by catastrophic damage to the plant, which is an impact to the property goal.  Additionally, the massive effort to cool the reactor is an impact to the labor goal.

The worker safety and property goals were impacted because of a hydrogen explosion, which was caused by a buildup of pressure in the plant, caused by increasing reactor temperature.  Heat continues to be generated by a nuclear reactor, even after it is shutdown, as a natural part of the operating process.  In this case, the normal cooling supply was lost when external power lines were knocked down by the tsunami (which was caused by the earthquake).  The tsunami also apparently damaged the diesel generators which provided the emergency cooling system.  The backup to the emergency cooling supply stopped automatically and was unable to be restarted, for reasons that are as yet unknown.

The outline, timeline and cause map shown on the PDF are extremely simplified.  Part of this simplification is due to the fact that as the event is still ongoing and not all information is known, or has been released. Once more information becomes available, it can be added to the analysis, or the analysis can be revised.

To learn more about the reactor issues at Fukushima Daiichi, view our video summary.  To see a blog about the impact of the fallout on the health of babies in the US, see our healthcare blog.

Two Killed in Barge/Tour Boat Collision

By ThinkReliability Staff

On July 7, 2010, a barge being propelled by a tug boat collided with a tour boat that had dropped anchor in the Delaware River.  As a result of the collision, two passengers on the tour boat were killed and twenty-six were injured.  The tour boat sank in 55 feet of water.

Detail regarding the incident has just been released in an updated NTSB report.  We can use the information about this report to begin a Cause Map, or visual root cause analysis.  The information in the report can also point us in the direction of important questions that remain to be answered to determine exactly what happened and, most importantly, how incidents like these can be prevented in the future.

In this case, a tour boat had dropped anchor to deal with mechanical problems.  According to the tour boat crew’s testimony and radio recordings, the tour boat crew attempted to get in touch with the tug boat by yelling and making radio calls.  Neither were answered or apparently noticed.  The barge that was being propelled by the tug boat crashed into the tour boat, resulting in deaths, injuries and loss of the tour boat.

The lookout on the tug boat was inadequate (had it been adequate, the tug boat would have noticed the tour boat in time to avoid the collision).  The report has determined that the tug boat master was off-duty and below-deck at the time of the collision.  According to cell phone records, the mate who was on lookout duty was on a phone call at the time of the collision and had made several phone calls during his duty. The inadequate lookout combined with the inability of the tour boat to make contact with the tug boat resulted in the collision.

There are two obvious areas where more detail is needed in the Cause Map to determine what was going on that led to the issues on the tug boat.  Specifically, why was the lookout on the cell phone and why wasn’t the tour boat able to contact the tug boat through the radio?  Because of the strict requirements for lookouts on marine duty, there is also an ongoing criminal investigation into the lookout’s actions.  When the final NTSB report is issued, and the criminal case is closed, these questions should be answered.  More detail can be added to this Cause Map as the analysis continues. As with any investigation the level of detail in the analysis is based on the impact of the incident on the organization’s overall goals.

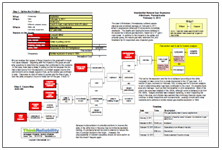
Residential Natural Gas Explosion

By ThinkReliability Staff

The town of Allentown, Pennsylvania suffered severe physical and emotional damage on February 9, 2011, when 5 people were killed and 8 homes were completely destroyed.  The deaths and destruction were believed to be caused by a natural gas explosion, fueled by a 12″ gas main break.  In addition to the impacts to the safety and property goals, the natural gas leak, extended fire, and time/labor by 53 responders also impacted goals.

We can analyze the causes of these impacts to the goals with a visual root cause analysis.  Beginning with the impacts to the goals, we ask why questions to determine the causes that contributed to the incidents.  In this case, there was a delay in putting out the fire because the fire had a heat source from the explosion, a constant oxygen source (the environment) and a steady supply of fuel, as the natural gas continued to leak.  There was no shut-off valve to quickly stop the flow of gas.  It took the utility company 5 hours to finally turn off the gas.  It took 12 more  hours before the fire was completely put out.

The fuel for the explosion and the fire is believed (according to the utility company) to have come from a break discovered in the 12″ gas main.  A 4′ section of pipe, removed on February 14th, is being sent for a forensic analysis to aid in determining what may have contributed to the crack.  It’s possible there was prior damage – such as that from weather or prior excavations.  Most of the pipe in the area was installed in the 1950s, although some is believed to be from the 1920s.  Budget shortfalls have delayed replacing, or even inspecting the lines in the area, and officials have warned that continuing financial issues may continue to delay inspections and improvements,  causing concern with many residents, who suffered a similar natural gas pipeline explosion in 1994.

Because implementation of potential solutions to improve the state of the utility lines in the area may be limited by available funding, it’s unclear what will be done to attempt to reduce the risk of a similar incident in the future.   However, the unacceptability of resident casualties should stir some action so that this doesn’t happen again.

Shuttle Launch May Be Delayed Again

By ThinkReliability Staff

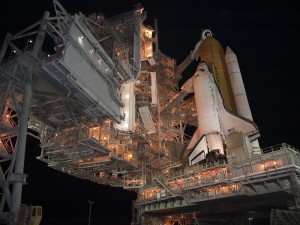
NASA’s plan to launch Discovery on its final mission continues to face setbacks.  As discussed in last week’s blog, the launch of Discovery was delayed past the originally planned launch window that closed on November 5 as the result of four separate issues.

One of these issues was a crack in a stringer, one of the metal supports on the external fuel tank.  NASA engineers haven identified additional stringer cracks that must also be repaired prior to launch.  These cracks are typically fixed by cutting out the cracked metal and bolting in new pieces of aluminum called doublers because they are twice as thick as the original stringers. The foam insulation that covers the stringers must then be reapplied.  The foam needs four days to cure, which makes it difficult to perform repairs quickly.

Adding to the complexity of these repairs is the fact that this is the first time they have been attempted on the launch pad. Similar repairs have been made many times, but they were performed in the factory where the fuel tanks were built.

Yesterday, NASA stated that the earliest launch date would be the morning of December 3.  If Discovery isn’t ready by December 5, the launch window will close and the next opportunity to launch will be late February.

NASA has stated that as long as Discovery is launched during the early December window the overall schedule for the final shuttle missions shouldn’t be affected.  Currently, the Endeavor is scheduled to launch during the February window and it will have to be delayed if the launch of Discovery slips until February.

In a situation like this, NASA needs to focus on the technical issues involved in the repairs, but they also need to develop a work schedule that incorporates all the possible contingencies.  Just scheduling everything is no easy feat.  In additional to the schedule of the remaining shuttle flights, the timing of Discovery’s launch will affect the schedule of work at the International Space Station because Discovery’s mission includes delivering and installing a new module and delivering critical spare components.

When dealing with a complex process, it can help to build a Process Map to lay out all possible scenarios and ensure that resources are allocated in the most efficient way.  In the same way that a Cause Map can help the root cause analysis process run more smoothly and effectively, a Process Map that clearly lays out how a process should happen can help provide direction, especially during a work process with complicated choices and many possible contingencies.

Space Shuttle Launch Delayed

By ThinkReliability Staff

Launching a space shuttle is a complicated process (as we discussed in last week’s blog).  Not only is the launching process complex, finding an acceptable date for launch is also complex.  This was demonstrated this week as the shuttle launch was delayed four times, for four separate issues and now will not be able to happen until the end of the month, at the earliest.

There are discrete windows during which a launch  to the International Space Station (which is the destination of this mission) can occur.  At some times, the solar angles at the International Space Station would result in the shuttle overheating while it was docked at the Space Station.  The launch windows are open only when the angles are such that the overheating will not occur.

The previous launch window was open until November 5th.  The launch was delayed November 1st for helium and nitrogen leaks, November 2nd for a circuit glitch, November 4th for weather, and November 5th for a gaseous hydrogen leak.  After the November 5th delay, crews discovered a  crack in the insulating foam, necessitating repairs before the launch.  These delays pushed the shuttle launch out of the available November launch window.  The next launch window is from December 1st through 5th, which gives the shuttle experts slightly less than a month to prepare for launch, or the mission may be delayed until next year.

Although not a lot of information has been released about the specific issues that have delayed the launches, we can put what we do know into a Cause Map.  A thorough root cause analysis built as a Cause Map can capture all of the causes in a simple, intuitive format that fits on one page.  Once more information is released about the specifics of the issues that delayed the launch, more detail can easily be added to the Cause Map to capture all the causes for the delay.  Additionally, the timeline can be updated to reflect the date of the eventual launch.

To view the problem outline, Cause Map, and launch timeline, please click on “Download PDF” above.

How a Shuttle is Launched

By ThinkReliability Staff

The Space Shuttle Discovery is expected to be launched November 4th, assuming all goes well.  But what does “all going well” entail?  Some things are obvious and well-known, such as the need to ensure that the weather is acceptable for launch.  However, with an operation as complex and risky as launching a shuttle, there are a lot of steps to make sure that the launch goes off smoothly.

To show the steps involved in shuttle launch preparation, we can prepare a Process Map.  Although a Process Map looks like a Cause Map, its purpose is to show the steps that must be accomplished, in order, for successful completion of a process.  We can begin a Process Map with only one box, the process that we’ll be detailing.  Here, it’s the “Launch Preparation Process”.  We break up the process into more detailed steps in order to provide more useful information about a process.  Here the information used was from Wired Magazine and NASA’s Launch Blog (where they’ll be providing up-to-date details as the launch process begins).

Here we break down the Shuttle Launch Process into 9 steps, though we could continue to add more detail until  we had hundreds of steps.  Some of the steps have been added (or updated) based on issues with previous missions.  For example, on Apollo I, oxygen on board caught fire during a test and killed the crew.  Now one of the first steps is an oxygen purge, where oxygen in the payload bay and aft compartments is replaced with nitrogen.  On Challenger, concerns about equipment integrity in extremely cold weather were not brought to higher ups.  Now there’s a Launch Readiness Check, where more than 20 representatives of contractor organizations and departments within NASA are asked to verify their readiness for launch.  This allows all contributors to have a say regarding the launch.  One of the last steps is the weather check we mentioned above.

Similar to the Launch Readiness Check, we can add additional detail to the Launch Status Check.  This step can be further broken down to show the checks of systems and positions that must be completed before the Launch Status step can be considered complete.  Each step within each Process Map shown here can be broken down into even more detail, depending on the complexity of the process and the need for a detailed Process Map.  In the case of an extremely complex process such as this one, there may be several versions of the Process Map, such as an overview of the entire process (like we’ve shown here) and a detailed version for each step of the Process to be provided to the personnel who are performing and overseeing that portion of the process.  As you can see a lot of planning and checking goes into the launch preparations!