Tag Archives: Cause Mapping

Rising Grain Prices 2003-2012

By ThinkReliability Staff

Grain prices have more than doubled since the year 2003, even down from their record high prices in 2008.  Grain is used for food, animal feed, and ethanol.  The demand for grain for all of these uses is increasing, but the supply is not keeping up.  This, along with other factors, has increased the price of grain to the point where it can be disastrous to the world’s poorest citizens.

We can examine the effect of the increased price of grain in a Cause Map.  A Cause Map allows us to lay out cause-and-effect relationships in an easy to understand, visual format.  To begin the Cause Map, we determine the impacts to the goals.  In this case, because we are looking at the grain price increases for the years 2003-2012 worldwide, our goals are broad.  The safety goal is impacted because there has been a high impact on the nutrition of the poor.  Grain prices have led to food riots in many locations, which is another impact to the safety goal.  The environmental goal has been impacted by the loss of usable cropland.  The increase in food prices can be considered an impact to the customer service goal.  Demand outpacing supply can be considered a production goal (considering the worldwide demand and supply).  Lastly, the increase in the price of grain itself can be considered an impact to the property goal.

Beginning with the safety goals: nutritional deficiency and food riots resulting from the increase in the price of food.  The increase in the price of food affects the poor in two ways – it reduces individual buying ability and reduces the amount of food aid that can be bought for the same amount of money.  In short, a country providing a consistent monetary amount of food aid will provide less aid when the food is more expensive.  This double whammy is further worsened considering the impact of the cost of fuel – as it increases, even less food can be bought per aid dollar.

The increase in the price of food is directly impacted by the price of grain.  Grain is used as a food itself, as well as feed for animals that are used for food, and is a component of many other produced foods.  The cost of all these foods go up as the price of grain increases.

Why is the price of grain increasing?  There are many factors that result in the increase in the price of grain.  Firstly the cost of grain goes up as the cost of the fuel needed to transport it and the cost of fertilizer needed to grow it increase.  As the demand for fertilizer grows, the cost grows.  The demand grows, as the demand for all crops grows.

The supply vs. demand equation also contributes to the cost of grain.  When demand increases, and supply does not keep up, cost goes up.  The demand for grain has been increasing – for food to feed the growing population, and to produce input-intensive foods, which actually require more grain.  (For example, about 7 kg of grain are required to get 1 kg of beef.  As the demand for input-intensive foods increases, the demand for grain increases even more.)  The government mandates and subsidies that require the use of grain for bio-fuels – driven by the   increasing cost of oil – also substantially increases the demand for grains.  Making matters worse, in order to attempt to protect their population and agricultural industry, countries have been restricting exports and/or hoarding, further decreasing available supply for trade.

Demand is not keeping up with supply.  The growth in agricultural productivity – which allows for a higher crop yield – has not increased as quickly as demand.  Crops are lost to agricultural pests, droughts and floods, and a particularly virulent strain of steam rust fungus, which has affected many grain crops.  Lastly usable cropland is being lost, due to urbanization to support that growing population, as well as erosion and water depletion, which can be impacted by poor land management.  In many cases, the investment and infrastructure to allow for agricultural advances just isn’t there.

The issues discussed above become a vicious cycle, making solutions that much more difficult and important.  Specifically, world organizations have asked countries to examine their agricultural policies, including ethanol mandates and subsidies, export restrictions and taxes, and hoarding.  Work on advanced bio-fuels or Brazilian sugar cane ethanol can reduce the amount of agricultural land devoted to producing crops for biofuels, rather than food.  Investment and development funds, as well as increased aid, are being sought to help remedy the current situation.  Import taxes into many countries that have food shortages have been reduced or removed to try to reduce the cost of food.  These are big solutions – for a big issue.  It is estimated that 16% of the world’s population is chronically under-nourished.  Further increases in the cost of food will only make the situation worse, without making some of the changes discussed here.

To view the Outline and Cause Map, please click “Download PDF” above.  Or click here to read more about the crisis and actions taken by the World Bank.

How a Toothbrush Helped Save the Space Station

By Kim Smiley

Using ingenuity reminiscent of Apollo 13, the crew on the International Space Station (ISS) recently found a way to fix an ailing electrical system using handmade tools made with an allen wrench, a wire brush, a bolt and a toothbrush.

The events that led to this dramatic repair attempt can be built into a Cause Map, a visual root cause analysis to help illustrate the causes that contributed to the problem. In this example, the problem was an issue with the electrical system on the space station.  Electrical issues can obviously quickly become dangerous on a space station because the life support systems need electricity to function. The impacts to the schedule and potential issues with accomplishing all the mission goals are also worth considering.

In order to fix the problem, astronauts needed to replace a failed Main Bus Switching Unit, a component that is responsible for collecting and distributing power from the solar arrays.  The ISS has four Main Bus Switching Units and each serves two of the eight solar arrays so the loss of a one of the units significantly impacts power supply.

The units are located outside of the space station and the plan was to replace the malfunctioning unit during a spacewalk, but the two astronauts doing the work ran into a problem.  An accumulation of metal shavings caused a bolt to stick, preventing installation of the new unit.  The astronauts needed to find a way to remove the metal shavings, but none of the tools they had taken on the spacewalk could get the job done.

The nearest hardware store was over 200 miles of atmosphere away and the options were limited, but the crew found an elegantly simple solution to the problem.  They created a cleaning tool out of items onboard the space station, including a $3 toothbrush.  An extra space walk was planned, the metal shavings were cleared and the new Main Bus Switching Unit was successful installed.  A cheap toothbrush taped to a metal handle had helped fix a $100 billion space station.

And if you’re wondering which Astronaut drew the short end of the oral hygiene stick, don’t worry the tooth brush was a spare.

To view a high level Cause Map of this issue, click on “Download PDF” above.

Delivering the Curiosity to Mars

By Kim Smiley

On August 6th, the Curiosity, NASA’s newest rover, safely landed on the surface of Mars.  The Curiosity is better equipped and larger than previous rovers, weighing about five times as much as the Spirit and Opportunity and carrying ten times the mass of scientific instruments. This extra weight meant that the previous methods used to deliver rovers to the Martian surface wouldn’t work and NASA had to design something that had never been tried before.

What NASA came up with was the concept of using a sky crane to hover over the surface of the planet while lowering the Curiosity to a soft landing.  This was a brand new design and the differences in atmosphere between earth and Mars meant it couldn’t be tested before it was launched into space.  There was only one chance to get it right.

When Curiosity, inside the Mars Science Laboratory (MSL) space probe, first hit the Mars atmosphere it was traveling approximately 13,200 miles per hour.  After friction had decreased the speed by about 90%, a massive parachute was deployed to farther slow the MSL.  The heatshield on the bottom was then released revealing the undercarriage of the Curiosity. The top of the probe, called the backshell, was released second along with the parachute.

This is the point when things start to resemble science fiction. Retro-grade rockets fired to slow down the machine inside the probe, known as the sky crane, until it hovered about 66 feet above the surface.  The sky crane then slowly lowered the rover using tethers until the rover was safely on the surface.

The whole process took about seven minutes.

In an amazing feat of engineering, the Curiosity was safely put on the Martian surface in the designated area.  So far the rover is functioning as designed and it is traveling the surface of another planet, transmitting data back to the earth.

Like all processes, the methods used to deliver the Curiosity can be built into a Process Map.  Process Maps can be built to any level of detail desired and used in a variety of ways.  A large Process Map could be built that included hundreds of boxes, documenting every detail of each component that needed to perform a task during the descent of the Curiosity for use by engineers working on the project or a higher level Process Map could be used to describe the process in general terms to give the public an overview of the procedure.

To view a high level Process Map showing how the Curiosity was delivered to the surface of Mars, click on “Download PDF” above.

Knife Cuts in Restaurants

By ThinkReliability Staff

Knife cuts in restaurants pose a big risk, not only to the restaurant employees themselves, but also to customers due to the potential risk of contamination by blood or bandages as a result of an employee who receives a laceration due to a knife cut.  There are steps that can be taken to reduce the risk of a knife cut.  While some of these steps can be taken by restaurant employees themselves, many will involve the restaurant management as well.  Although these recommendations are based on knife cuts that occur within the restaurant and food preparation industry, they are also relevant for use at home to protect against lacerations from knives.

You can view some different causes that can result in lacerations from knives in a Cause Map, or visual root cause analysis, by clicking “Download PDF” above.   With any root cause analysis, the goal is to determine as many solutions as possible to reduce the risk of the issue – in this case, knife cuts – from happening in the future.  When we put together a proactive investigation – not based on one specific incident, but rather combining any possible causes we can brainstorm to best determine solutions – we can use some examples of actual lacerations that have occurred, and also our personal experiences to brainstorm causes.  As with any investigation, the wider net we cast, the more ideas we brainstorm and the more possible solutions we can discover.

The setup of the food prep area is key to reducing cuts.  Inadequate lighting and distraction can lead to increased injury, as can the storage location of the knives.  (You’re much more likely to cut yourself grabbing a knife out of a drawer than off a magnetic strip or out of a block.)  The condition of the knives themselves is also key.  Properly maintained knives – that is, knives that are sharpened and the handles are properly attached – are less likely to cause cuts because dull knives, or those with loose handles, make it difficult to cut properly, increasing the risk of cuts.  Knives should be regularly sharpened and if a knife is damaged, it should be disposed of.  In addition, having the proper compliment of knives is important.  Proper cutting technique can reduce knife cuts, but a key component  to proper cutting technique is having the correct knife.

An additional component of proper cutting technique is training.  Training should include techniques for cutting as well as which knife to use for which type of cutting and what kind of food product.  Some of the key aspects to knife cutting technique that can decrease the incidence of knife cuts include: cut away from you, using a cutting board with a mat to keep it from slipping.  Hold objects with your fingers pointing straight down, using your knuckles as a guide for the knife.  It’s very difficult to cut yourself while holding a knife this way.

Not all knife cuts occur while cutting food.  One frequent source of knife cuts is reaching into a sink full of soap water and grabbing a knife blade.  When hand washing knives, put it one knife at a time and don’t let go of it.  Always set knives well onto the counter with the blade facing away from you.  And if a knife falls off a prep surface, step back and let it fall.  If you are particularly concerned about knife cuts, you may want to consider the use of Kevlar gloves.  Restaurants that use Kevlar gloves have seen a remarkable decrease in injuries due to knife cuts.

To view the Cause Map, please click “Download PDF” above

Slips, Trips and Falls: A Root Cause Analysis Primer

By ThinkReliability Staff

Slips, trips and falls happen every day.  Falls are responsible for tens of thousands of deaths each year.  (Slips and trips are considered a subset of falls, and are included in these numbers.)  Falls on the job account for 12-15% of all worker’s comp costs.  The direct and indirect costs of workers injured and killed on the job are estimated to be billions of dollars each year, both in worker’s comp claims and in lost productivity.  In 1999, as an example, 5,100 workers were killed by falls and over 570,000 injuries were reported.  However, there are many things that can be done to prevent and lessen the impact of falls.  Performing a Cause Map, a visual root cause analysis, will allow us to identify all the potential causes of falls.  A thorough root cause analysis built as a Cause Map can capture all of the causes in a simple, intuitive format that fits on one page.  Once we’ve done that, we can identify all the solutions.

A worker is injured during a fall because the worker strikes the floor, or another object, and the object contacted is hard, and the worker hits in a way that causes injury.  When we say that workers are injured because they hit an object in a way that causes injury, what we are really talking about is factors that worsen a fall, and make injury more likely. The worker could land on a part of his or her body that is more easily injured.  Another way that injuries can be worsened is if a worker falls farther than his or her height (i.e., not a same-level fall).

The worker strikes the floor or other object because he or she falls, and there is no other support for the body, such as a handrail, or a harness.   There are four different ways to fall: slips, trips, the “step and fall” (where a person gets off-balance while stepping), and becoming unbalanced on moving equipment.

A worker slips when there is inadequate traction, either because the force of stepping off is too high, or the coefficient of friction is too low.  The force of stepping off can be higher than average if the worker is walking quickly or running, making a sudden change in direction, or if he or she has an awkward gait, from injury or old age, for example.  The coefficient of friction is a function of the traction provided by the shoes the worker is wearing and the “slipperiness” of the walking surface.  The coefficient of friction is too low if the traction of the worker’s shoes is inadequate and if the floor is slippery, because the surface is wet, icy and/or oily and does not have a non-skid coating.  Of course, for this to be an issue at all, the worker has to step into the slippery area.

A worker can become off-balance by encountering an unexpected height difference (known as the “step and fall”).  This occurs in one of two ways.  Either the front foot lands on a surface lower than expected, or the ankle turns due to one side of the foot ending up higher than the other side, with footwear that inadequately supports the ankle.  These are both due to an unexpected height difference.

When a worker trips, it is because his or her toe is stopped, but his or her upper body is not stopped.  The upper body is moving because the worker is moving and he toe is topped because it encounters an object in the walking path, a rise in the walking path, or a difference in height of subsequent stairs.

Last but not least, falls can be caused by workers who become unbalanced on moving equipment.  For this to occur, the worker must be inadequately secured to the equipment while the equipment changes motion, either by turning, decelerating or stopping, or accelerating or starting to move.

Once we have built our Cause Map and found all the potential causes, we can assign potential solutions to all appropriate causes.  The solutions are in green boxes, near the cause(s) they “solve”.   You can see that some of the solutions are the responsibility of the company, and some are the responsibility of the worker, and some are both.   Although many of the responsibilities lie with the worker, it is in a company’s best interest to provide training on how to prevent, manage and mitigate falls.  Falls may seem like everyday, ordinary minor occurrences, but the consequences can be anything but minor.

Planes Nearly Collide Over DC

By ThinkReliability Staff

Two planes came within seconds of a collision on  July 31, 2012 when both were directed to the same airspace by controllers.  Although no incident occurred, such near misses should be investigated thoroughly to prevent incidents in the future.

We can perform a root cause analysis of this incident in visual Cause Mapping form.  We begin with the impacts to the goals.  In the case of a near-miss like this one, some of the impacts to the goals will be hypothetical, based on the potential of the incident actually occurring.  For example, the safety goal is impacted because of the potential of death or injury to the passengers and crew on the planes.  The property goal is also impacted due to the potential of damage to the planes.  Even though this incident was considered a near-miss, there were some actual impacts to the goals, such as the delay in landing of the inbound plane, which can be considered an impact to the customer service, schedule, and  labor goal.

Once we have determined the impacts to the goals, we can begin the analysis by asking “why” questions.  In this case, the safety and property goals were impacted due to the potential collision of two planes.  These planes could have collided because they were on a collision course.   One plane was taking off directly towards another  plane that was trying to land.  The landing plane was landing in the opposite direction as usual (from the South instead of from the North) in order to avoid high winds from an incoming storm.  The plane taking off was cleared to take off towards the incoming plane (towards the South) by a different controller who was unaware that incoming planes were coming in from a different direction.  Communication of the change in incoming flights was not made to all controllers in the area and, although no details are available, it appears that the procedure used by the controllers when changing the flow towards the airport was inadequate.

There are thousands of recorded errors by air traffic controllers every year, and Reagan National (where this incident occurred) has had some particularly high-profile incidents, such as when a controller fell asleep (see   previous blog), involving air traffic controllers.  On August 10, 2012, two aircraft clipped each other at another Washington, DC area airport, although it is unclear if controllers were involved.  (See the article here.)  A congressional and FAA investigation is underway, and will hopefully address some needed improvements in air safety.

To view the Outline and Cause Map, please click “Download PDF” above.

11 Year Old Flies to Rome from England without Ticket or Passport

By Kim Smiley

On July 25, 2012, an 11 year old boy managed to sneak aboard a flight to Rome from Manchester England without a ticket or a passport.  No one noted the presence of the extra passenger until other passengers informed airline staff that the boy had told them he was running away from home and seemed suspicious.  The timing of this incident was unfortunate since it occurred a few days before the start of the Olympics and raised more questions about British security.

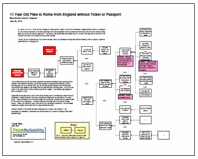
How did a boy manage to depart on an aircraft without any of the proper documentation?  This incident can be analyzed by building a Cause Map, a visual root cause analysis which intuitively shows the relationships between the causes that contributed to the issue.

In this example, the boy was able to sneak onto the flight because the extra passenger wasn’t noted in the head count and he got through five separate security checks.  The boy did not circumvent any of the normal security checks, he just walked through them without showing a shred of paper or anybody questioning him or stopping him.

The boy was able to get into the secure departure area without showing a ticket, get through the passport check without a passport, get through security screening without showing a ticket or boarding pass (he did go through the x-ray), get through the gate passport and boarding pass check without any paperwork and finally board the plane without a boarding pass.  Add in the final failure of the head count to notice an extra body and an English 11 year without any paperwork was on his way to Rome.

Apparently the boy was able to pull off this feat by sticking close to families with children and took advantage of situations where one family member was showing the documentation for a large group.   Video surveillance from the airport shows him acting very confident and his behavior gave no one reason to be suspicious.  The airport was also very busy due to the summer holiday season. Throw in an ineffective head count and the end result was a significant, if not particularly dangerous, security breach days before a huge international event.

Several members of the airline staff were suspended as a result of this incident.  A full investigation is underway to understand the incident and work to ensure something similar never happens again.

To view a high level Cause Map of this incident, click on “Download PDF” above.

Hindenburg Crash – May 6, 1937

By ThinkReliability Staff

On May 6th, 1937, the Hindenburg burst into flames over the Lakehurst, NJ Naval Base, after completing a successful trip across the Atlantic.  35 of the 97 passengers (and one of the ground crew) were killed.  The Hindenburg itself was a total loss, and the popularity of airships never recovered after the accident.

The loss of 36 lives and the loss of the Hindenburg were both caused by the fire aboard. The loss of popularity of airships was caused by both the loss of the Hindenburg, and by the loss of lives.  The next question to ask is “Why did the fire occur?”

For the Hindenburg, this is where things start to get interesting.  There are three separate theories about why the fire started.  There are people who believe very strongly in each.   Luckily for us, the beauty of the Cause Map form of a root cause analysis is that we can use it even if we haven’t determined which theory is correct.

The first theory is that the fire started from sabotage.  Because the Hindenburg was frequently used as a Nazi propaganda tool, some thought it was almost too easy of a target for sabotage from anti-Nazi activists (who included in their number the designer of Hindenburg, Dr. Hugo Eckener.)  There was even a “suspicious” character who survived the crash, a German acrobat living in America.  However, eventually the FBI dismissed the idea of sabotage as a “red herring.”

Another theory is that the fire began when static electricity ignited the flammable cover of the airship.  The major proponent of this theory, Dr. Addison Bain, has run tests on pieces of the Hindenburg cover preserved from the wreck site.  (This was not until 1994.)  He has also found supporting evidence from historic records of the Zeppelin company.

The other theory is that static electricity ignited a flammable hydrogen-oxygen mixture.  This was the original cause attributed to the disaster by the U.S. Department of Commerce’s root cause analysis investigation after the crash.  There are also people who claim that Dr. Bain’s theory is physically impossible, and do not specifically champion a cause, but treat this one as the most likely.

Note that we’re not espousing a theory – we are just recording all of the possibilities.  Once we have done that, the Cause Map allows us to find solutions for any potential causes.  Once we have all the theories mapped out, we can use the Cause mMp as a resource to determine the solutions that are most helpful, or continue our root cause analysis investigation to determine which causes are most likely.

Navy Jet Crashes into Apartment Building

By Kim Smiley

On April 6, 2012, a Navy F-18 jet crashed into an apartment building in Virginia Beach, Virginia. Significant damage was done to the apartment building and the jet was destroyed, but amazingly no one was seriously injured or killed.

This incident can be analyzed by building a Cause Map, an intuitive, visual format for performing a root cause analysis.  The first step when building a Cause Map is to determine how the incident affected the organizational goals.  The impacts to the organizational goals are recorded in the Outline which also documents the background information of the incident.  In this example, the safety goal was obviously impacted since there was potential for serious injuries.  The property goal was also impacted because the jet was destroyed and the apartment building suffered extensive damage.

Once the Outline is complete, “why” questions are asked to determine what factors contributed to the incident.  In this example, there was potential for injuries because a jet hit an apartment building.  This occurred because the jet was flying near the residential area and the jet was unable to complete its attempted take off.  The pilots could have been injured had they not been able to safety eject before the crash and there was potential for people on the ground to be injured since the jet crashed into a residential area. The jet crashed because it experienced a dual engine failure.  The investigation into this crash determined that that both engines failed for two separate, unrelated reasons.

The right engine failed because of a catastrophic failure of the engine compressor when it ingested flammable liquid that was ignited.  The left engine afterburner failed to light. Investigators believe that an electrical component failed, but the damage to the left engine was too severe for a conclusive determination of what exactly occurred.   According to the Navy, this is the first unrelated dual engine failure of a F-18.

The Navy plans to update procedures to incorporate the possibilities of this type of incident.

To view a high level Cause Map of this issue, click on “Download PDF” above.

Loss of Firefighting Plane Affects Firefighting Efforts

By ThinkReliability Staff

Wildfires in the Rocky Mountain region have been plaguing the nation for weeks.  The firefighting mission took a severe hit when a C-130 that was dropping flame retardant on the fire crashed on the evening of July 1, 2012, killing four of six crewmembers and injuring the other two.  As a result of the crash, the Air Force grounded other C-130s for two days, increasing the work for firefighters on the ground.

Although the Air Force has not released details of what exactly resulted in the plane crash, we can look at the information we do have available in a visual root cause analysis or Cause Map.  We begin by determining which of the organization’s goals were impacted in the Outline.  First, because of the deaths of the crewmembers, the safety goal was impacted.  The environmental and customer service goals were impacted because of the decreased ability to fight wildfires.  The schedule goal was impacted because other C-130s were grounded for two days.  The property goal was impacted because of the damage to the plane, and the labor goal was impacted due to the increased difficulty for remaining firefighters in fighting the fire.

Once we have determined these impacts to the goals, we can begin asking “Why” questions to draw out the cause-and-effect relationships that led to the impacted goals.  The safety, and other goals, were impacted due to the plane crash.  Again, although the Air Force has not released details of its ongoing investigation, it is believed that  downdraft (caused by the same high winds in the area that are helping to keep the wildfires travel) may have contributed to the crash.  An additional contributor is the fact that the plane was likely traveling at extremely low altitude, which allowed the plane to perform its task to help fight wildfires.  Lastly, it is possible that the heavy demands placed on the plane due to the extent of the fires may have contributed to the incident.  If, during the course of the investigation, it is determined that one of these causes was not related to the plane crash, the causes can be crossed out, but left on the map.  Evidence that shows that this cause did not result in the incident should be placed under the box.  This allows us to keep a complete record of which causes were considered.

Once the causes related to the incident have been placed on the map, solutions to mitigate the risk of this type of incident from happening again can be brainstormed and implemented.

To view the Outline and Cause Map, please click “Download PDF” above