Tag Archives: environmental

Rogue Ocean Fertilization Experiment Done

By Kim Smiley

An entrepreneur created a massive bloom of plankton after he dumped a hundred tons of iron dust into the Pacific Ocean off western Canada last June.  This action has sparked outrage because an individual manipulated the environment without government approval or scientific oversight.

A Cause Map, a visual format for performing a root cause analysis, can be built to analyze this issue.  The first step in building a Cause Map is to determine how the issue impacts the overall goals.  The next step is to ask “why” questions and the answers are then organized into cause-and-effect relationships so that all factors that contributed to a problem are laid out in an intuitive format.  In this example, impacts to several goals are worth considering.

The first issue is that nobody knows exactly how the environment will respond to this much iron being put into the ocean.  The environmental impacts may well turn out to be minimal, but this is by far the largest experiment of this type done to date so nobody really knows how big the impact will be.  The experiment is also particularly worrisome because there wasn’t adequate scientific oversight or approvals for it.  The man conducting the experiment was an entrepreneur hoping to make money.  A local tribe hired the entrepreneur to fertilize the ocean with iron in a bid to increase the local salmon population by increasing their food supply.  Adding iron to the ocean can create a rapid increase in the phytoplankton population, which are the base of the aquatic food chain, because iron is often the limiting nutrient for phytoplankton growth.  Iron is necessary for photosynthesis and thus phytoplankton growth.  But iron is also highly insoluble in sea water so large areas of the ocean have limited iron supplies.

The entrepreneur also hoped to find a way to cash in on carbon offset credits because phytoplankton blooms may be a way to sequester carbon and improve greenhouse gas numbers in the environment.  This may work because phytoplankton absorb carbon dioxide during their life and when they die they sink into the ocean, taking the carbon dioxide with them and removing it from the atmosphere.

The second issue is that there are known risks associated with large blooms of phytoplankton.  They can negatively affect the other aquatic life in the region because large blooms can deplete the ocean of oxygen.  This occurs because the populations of other microorganisms will increase since the increase in phytoplankton provides a larger food supply.  Some of these other microorganisms absorb oxygen so more of them means less oxygen for other aquatic life. Phytoplankton live near the surface, but they sink as they die so a bloom will impact the food supply and oxygen levels throughout the entire depth of the ocean.

A final goal worth considering is the impact this has on public opinion.  Iron fertilization is a contentious issue to begin with because many people are opposed to purposefully manipulating the environment.  When somebody dumps tons of iron into the ocean without solid scientific involvement it understandablely outrages the public. The negative press will make it harder for any legitimate scientific research being done in this field.

This issue has been covered by The New York Times , The New Yorker  and NBC news. Click on any of these links to learn more about this issue.  Click on “Download PDF” above to view a high level Cause Map.


Why Giant Pandas are Endangered

By Kim Smiley

Panda breeding programs continue to struggle, a fact unfortunately highlighted by the recent death of a week old panda cub at the National Zoo on September 23, 2012.  Breeding programs are an important part of the panda conservation effort since the adored animals are endangered with only an estimated 1,600 remaining in the wild and about 300 in captivity.

The factors that contributed to pandas becoming endangered can be analyzed by building a Cause Map, a visual root cause analysis.  A Cause Map is an intuitive way to show the cause-and-effect relationships between the different causes that contribute to an issue. In this example, a good starting point is to ask why pandas are endangered.  This happened because there aren’t enough viable habitats, pandas have a low birth rate and panda cubs have a high mortality rate.

The panda habitat has significantly decreased because the bamboo forests are being cleared as the region becomes more industrialized.  Pandas also need a large habitat.   They are large animals who consume mostly bamboo so a lot of it is needed to sustain them.  The average panda can consume 20 to 30 pounds of bamboo shoots each day. They are also solitary, territorial creatures and do not like to live close to each other.

Pandas also have a notoriously low birth rate, in the wild and especially in captivity.  Female pandas are only fertile once a year for a very short window, about 36 hours.  In the wild, pandas have to find a mate (that they don’t typically live near) while fertile to produce a cub for the year.  Pandas in captivity struggle with conception even when they share an enclosure with a potential mate because they seem to lose interest in “natural breeding”.  The recent cub born at the National Zoo was the product of artificial insemination.  If a panda does manage to conceive, she will still only raise a single cub per year.  Most of the time only a single baby is born, but even if twins occur only one usually survives.

Panda cubs that are born also face a high mortality rate.  Twenty-five percent of panda cubs born in the US don’t survive their first year and the numbers are lower in the Chinese breeding centers.  This occurs because panda cubs are born very small, about the size of a stick of butter, and immature.  The newborns are helpless, pink and blind and require a lot of care taking to survive.  There is also the heart breaking chance that a mother panda can inadvertently injure her cub because she is much larger than her newborn and needs to handle it frequently to nurse it and care for it.

At this point, no captive panda has successfully been reintroduced into the wild and it’s unlikely that they will be in the foreseeable future.  Only time will tell if conservation efforts are successful for the giant pandas.

To view a high level Cause Map of this issue, click “Download PDF” above.

Rising Grain Prices 2003-2012

By ThinkReliability Staff

Grain prices have more than doubled since the year 2003, even down from their record high prices in 2008.  Grain is used for food, animal feed, and ethanol.  The demand for grain for all of these uses is increasing, but the supply is not keeping up.  This, along with other factors, has increased the price of grain to the point where it can be disastrous to the world’s poorest citizens.

We can examine the effect of the increased price of grain in a Cause Map.  A Cause Map allows us to lay out cause-and-effect relationships in an easy to understand, visual format.  To begin the Cause Map, we determine the impacts to the goals.  In this case, because we are looking at the grain price increases for the years 2003-2012 worldwide, our goals are broad.  The safety goal is impacted because there has been a high impact on the nutrition of the poor.  Grain prices have led to food riots in many locations, which is another impact to the safety goal.  The environmental goal has been impacted by the loss of usable cropland.  The increase in food prices can be considered an impact to the customer service goal.  Demand outpacing supply can be considered a production goal (considering the worldwide demand and supply).  Lastly, the increase in the price of grain itself can be considered an impact to the property goal.

Beginning with the safety goals: nutritional deficiency and food riots resulting from the increase in the price of food.  The increase in the price of food affects the poor in two ways – it reduces individual buying ability and reduces the amount of food aid that can be bought for the same amount of money.  In short, a country providing a consistent monetary amount of food aid will provide less aid when the food is more expensive.  This double whammy is further worsened considering the impact of the cost of fuel – as it increases, even less food can be bought per aid dollar.

The increase in the price of food is directly impacted by the price of grain.  Grain is used as a food itself, as well as feed for animals that are used for food, and is a component of many other produced foods.  The cost of all these foods go up as the price of grain increases.

Why is the price of grain increasing?  There are many factors that result in the increase in the price of grain.  Firstly the cost of grain goes up as the cost of the fuel needed to transport it and the cost of fertilizer needed to grow it increase.  As the demand for fertilizer grows, the cost grows.  The demand grows, as the demand for all crops grows.

The supply vs. demand equation also contributes to the cost of grain.  When demand increases, and supply does not keep up, cost goes up.  The demand for grain has been increasing – for food to feed the growing population, and to produce input-intensive foods, which actually require more grain.  (For example, about 7 kg of grain are required to get 1 kg of beef.  As the demand for input-intensive foods increases, the demand for grain increases even more.)  The government mandates and subsidies that require the use of grain for bio-fuels – driven by the   increasing cost of oil – also substantially increases the demand for grains.  Making matters worse, in order to attempt to protect their population and agricultural industry, countries have been restricting exports and/or hoarding, further decreasing available supply for trade.

Demand is not keeping up with supply.  The growth in agricultural productivity – which allows for a higher crop yield – has not increased as quickly as demand.  Crops are lost to agricultural pests, droughts and floods, and a particularly virulent strain of steam rust fungus, which has affected many grain crops.  Lastly usable cropland is being lost, due to urbanization to support that growing population, as well as erosion and water depletion, which can be impacted by poor land management.  In many cases, the investment and infrastructure to allow for agricultural advances just isn’t there.

The issues discussed above become a vicious cycle, making solutions that much more difficult and important.  Specifically, world organizations have asked countries to examine their agricultural policies, including ethanol mandates and subsidies, export restrictions and taxes, and hoarding.  Work on advanced bio-fuels or Brazilian sugar cane ethanol can reduce the amount of agricultural land devoted to producing crops for biofuels, rather than food.  Investment and development funds, as well as increased aid, are being sought to help remedy the current situation.  Import taxes into many countries that have food shortages have been reduced or removed to try to reduce the cost of food.  These are big solutions – for a big issue.  It is estimated that 16% of the world’s population is chronically under-nourished.  Further increases in the cost of food will only make the situation worse, without making some of the changes discussed here.

To view the Outline and Cause Map, please click “Download PDF” above.  Or click here to read more about the crisis and actions taken by the World Bank.

Lead Poisoning Threatens California Condor Population

By Kim Smiley

A recent study found that lead poisoning remains a significant hurdle to the recovery of the California condor population, one of the world’s most endangered species.  Scientists reviewed blood samples taken from wild California condors between 1997 and 2010 and found that many birds have dangerously high levels of lead in their bodies.  Nearly half of the birds had lead levels that were high enough that they could have died without treatment.

This issue can be analyzed by building a Cause Map, a visual root cause analysis. The first step in beginning a Cause Map is to determine the impact to the overall organization goals.  In this example, the environmental goal is impacted because an endangered species is threatened.  To continue building the Cause Map, “why” questions are asked and the answers are added to the Cause Map to show the cause-and-effect relationships between the things that contributed to the issue.  To view a high level Cause Map of this issue, click “Download PDF” above.

In the case of California condors, the species is threatened because the birds are ingesting lead and it’s dangerous.  Lead is dangerous because it is a poison that can cause illness or death.  The birds are ingesting lead because they eat a large number of animals and some of the animals contain lead.

There is lead in some of the animals because California condors will eat gut piles and carcasses left behind by hunters and these animals may contain fragments from lead bullets.  Additional causes are the fact that lead bullets are very common and that hunting is allowed in condor country.  This is caused in part because condors have large habitats because of their large range.  Condors are huge birds with wingspans of nearly 10 feet and they must travel long distances to find the large amount of food they require.

Determining the best way to prevent lead poisoning in condors is a difficult question for scientists.  Part of the problem is that a very small amount of lead can cause dangerous lead levels in a condor.  A single bullet fragment can be deadly. The short term solution is to treat the birds for lead poisoning by feeding them calcium-based drugs that bind with lead and remove it from the birds. One solution that has been tried is a California law banning lead bullets in the areas populated by condors, but the study found that it has had little impact in lead levels.  The issue of how to deal with the California condor lead poisoning issue without extensive ongoing human intervention and medical treatment remains open.

Pipeline Spill in Alberta Threatens Drinking Water

by ThinkReliability Staff

A pipeline spill in Alberta, Canada of up to 480,000 litres was noticed on the evening of June 7, 2012.  Although pipelines are estimated to spill approximately 3.4 million litres a year, they are not frequently near populated areas or water sources.  However, due to the proximity of this spill to a drinking water source, there was the potential of impact to drinking water.  An issue of this magnitude, with this type of impact, is thoroughly investigated to reduce the risk of recurrence.  We can examine this issue in a visual root cause analysis performed as a Cause Map.

We begin with the impacts to the goals.  In this case, the safety goal is impacted because of the potential impact to drinking water.  The environmental goal is impacted because of the spill of sour crude oil.  The spill is impacting area residents in a variety of ways, which can be considered an impact to the customer service goal.  The production goal was impacted due to a 10-day shutdown of a portion of the pipeline.  The property goal is impacted by the damage to the pipeline, and the labor goal is impacted by the response and cleanup required.

Once we have developed the impacts to the goals, we can ask “Why” questions to develop the cause-and-effect relationships that resulted in those impacts.  The potential impact to drinking water resulted from the proximity of the spill to a drinking water source, because the spill was in a populated area, and the oil spill itself.  The oil spill resulted from damage to the pipeline and the time elapsed before the spill was stopped.  Because the longer a spill goes undetected, the more environmental impact it has, consideration of the adequacy of monitoring, inspection and testing must be considered to ensure that this risk is reduced.

Although the cause of the pipeline damage is still being investigated, causes that have resulted in prior pipeline damage include construction damage, internal corrosion, and external corrosion.  External corrosion can result from exposure to water, which in this case was impacted by recent flooding of the river and shallow burying of the pipe, as was typical with earlier installations.  The age of the pipe may have also impacted the internal corrosion, as the more time that pipe is exposed to hydrocarbons (which the pipe transmits) the more corrosion will occur.

Immediate solutions include isolating the damaged area with a valve.  Then repairs were made to the pipeline, and cleanup began.  Cleanup is expected to take most of the summer.  There have been calls for increased monitoring, testing, and inspection of the line, and with an incident of this type, that frequency should be examined to ensure it is appropriate to minimize these types of risk.

To view the Outline, Cause Map, and Solutions, please click “Download PDF” above.

Cleaning Up Aerosols May have Fueled Hurricanes

By Kim Smiley

A recent study by Britain’s Met Office weather service found that reducing pollutants in the atmosphere has had an unintended consequence, an increase in intense hurricane activity in North America.

A Cause Map, a visual root cause analysis, can be a helpful tool to understand this type of issue.  A Cause Map shows the cause and effect relationships between the different causes that contribute to an issue and can illustrate the potential consequence of changing one cause.

In this example, the problem is that hurricane activity has been increasing in the Atlantic Ocean.  Previous studies have found a link between a rise in ocean temperature and the increase in hurricane activity. Higher temperatures result in more intense hurricanes because there is more water vapor in the air because more water evaporates at higher temperatures.  More heat is released as the water vapor condenses into rain and this heat fuels the hurricane.

The surface temperature of the Atlantic Ocean has increased a small amount, about half a degree Celsius since 1970.  Scientists are not in agreement about the cause of this temperature increase.  Some people believe that the change is simply part of the natural long term variability of ocean temperatures.  Other scientists believe that global warming has caused the higher temperatures.  This new study adds a new dimension to the discussion.

The Met office study found that the reduction in aerosol pollutants in the air caused the rise in the ocean temperature.  Aerosols play a role because they affect the way clouds form.  More aerosols result in brighter, longer lasting clouds so reducing the aerosols in the atmosphere means that there will be fewer clouds over the ocean.  Fewer clouds mean that less sunlight is reflected away.  All this means that more sunlight will hit the ocean, increasing temperatures.

Fewer aerosols are in the environment because they cause acid rain and legislation was passed that limits how much can be released into the environment.

This issue is further complicated when the weather pattern is viewed on a global scale.  When the ocean temperature is cooler, there is less hurricane activity bombarding the United States, but then there are severe droughts in Africa.  Additional studies will be needed to confirm the findings on the effects of aerosol pollutants, but this new information is an interesting piece of the climate puzzle.

Combination of Gas Leak and Flare Could be Disastrous

By ThinkReliability Staff

A leak from the Elgin platform in the north sea near Aberdeen has the potential to cause an explosion due to the proximity of the leak to the still-lit flare on the platform.  However, the wind is currently blowing gas away from the flare.  The potential for environmental damage is not as great as that of Deepwater Horizon because it is a surface, rather than underwater, leak.

Workers on the now-evacuated Elgin rig noticed the leak on March 25, 2012.  The rig was partially, then later fully, evacuated.  We can examine the causes of the environmental leak, as well as the potential for further damage, in a visual root cause analysis in the form of a Cause Map.  The Cause Map lays out the cause-and-effect relationships in a clear, intuitive way.

We begin with the impacts to the goals.  The safety goal is impacted because of the potential for an explosion.  The environmental goal is impacted due to the gas leak, estimated to be approximately 200 cubic metres per day.  The customer service goal is impacted due to the loss of value of the owner corporation stock shares.  Production is currently shut down on the rig, leading  to an impact to the production goal.  The potential for an explosion could also cause catastrophic damage to the platform, which is an impact to the property goal.  Lastly, the evacuation of the platform is an impact to the labor goal.

In order for an explosion to occur, there must be fuel, oxygen, heat and confinement.  In this case, the oxygen is provided by the atmosphere, and the confinement is provided by the well itself.  The fuel is provided by the gas leak, believed to be entering from another non-producing well through a crack in the outer casing of the well, which was in the process of being plugged and abandoned.    The heat likely to cause the explosion is a flare on the platform.  The flare burns off excess gas from the platform and was not extinguished during the evacuation, as the priority was to remove the workers.

The flare is unable to be turned off remotely, but options for extinguishing the flare are being evaluated.  Other options being evaluated to stop the leak and reduce the potential for explosion include digging a relief well or killing the well that is currently leaking.  All options have the potential to be very expensive.

To view the Outline and Cause Map, please click “Download PDF” above.

Collapse of Gulf of Maine Cod Population Feared

By Kim Smiley

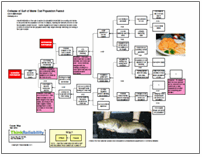
Recent estimates of the Gulf of Maine cod population show that cod is being over fished to the point that the population is at risk of collapse, meaning the numbers become so low the population cannot recover.  Federal regulators are trying to determine the best course of action to protect the fish population which may include severely restricting cod fishing in the Gulf of Maine.

The declining cod population problem can be analyzed by building a Cause Map, an intuitive, visual root cause analysis.  The first step in building a Cause Map is to determine what goals are impacted by the issue.  In this case, the environmental goal is impacted because the cod population may collapse, but the economic impacts of this issue are also a major concern.

Cod has long been a major source of income for New England fishermen, bringing in $15.8 million in 2010.  Restricting cod fishing would also impact the ability to catch other fish because cod is often also bought up in nets when other fish are targeted.  Cod are bottom swimmers along with other popular fish such as flounder and haddock and it’s impossible to catch one type of fish without catching the others.

The cod population is declining because the fish are not reproducing fast enough to keep up with fishing. Fishing of cod occurs for several reasons.    First, cod is caught and sold because it is profitable.  Cod meat is high in protein, low in fat and easily filleted. Additionally, federal regulations allows fisherman to catch a set quota of cod.  One of the potential causes of the declining cod population may be that these quotas are set too high to for the cod population to continue to grow.

The federal limits on cod fishing over the past few years were set based on information from 2008 that showed a significantly higher cod population than the estimates determined by the recent population assessment.  It’s not clear why the numbers of cod varied so dramatically between the current estimates and the ones from 2008, but the dramatic swing in fish population estimates has been a source of many complaints by fishermen.  It may also be worth considering whether any environmental factors have impacted the fish population.  Cod population can be affect by many factors besides fishing, such as varying ocean temperatures or changes in their food supply.

After considering severe cuts of up to 82 percent, federal regulators appear to be willing to reduce the amount of cod allowed to be caught by only 22 percent for the 2012 fishing season.  This is only a one year agreement and fishermen will likely face severe cuts on cod fishing limits again in 2013.   At this time it’s not clear whether there is a way to save the historic fishing industry in the Gulf of Maine and ensure a healthy population of cod in the region.

To view a high level Cause Map of this issue, click “Download PDF” above.

Number of Poached Rhinos Hits All Time High

By Kim Smiley

Rhinoceros, commonly called rhinos, have long been hunted for their horns.  Three of the five species of rhinos are considered critically endangered.  According to the National Geographic News Watch, at least 443 rhinos were killed in South Africa in 2011, a significant increase from 333 the previous year.  South Africa is home to more than 20,000 rhinos, which is over 90% of the rhinos in Africa.  For a little perspective on how significantly the problem has grown, South Africa only lost about 15 rhinos a year a decade ago.

Experts in the field have concluded that the number of rhinos lost through unnatural means, both illegal poaching and the less common legal hunts allowed by the government, will result in a decline in the population of rhinos.

This problem can be investigated by building a Cause Map, an intuitive, visual root cause analysis method.  To begin a Cause Map, the impact to the organizational goals is first determined and then “why” questions are asked to add Causes to the map.  In this example, the major organizational goal being considered is the impact to the environmental.  The environmental goal is impacted because the poaching of rhinos hit an all time high.  This happened because of two things, poachers want to hunt rhinos and the methods in place to prevent poaching are ineffective.

Poachers want to hunt rhinos because the black market value of their horns is extremely high.  They are worth more than gold by weight.  Poachers are able to sell the horns for high prices because consumers are both willing and able to pay huge sums.  There is a strong market for rhino horn because of long standing beliefs that rhino horn has medicinal uses, primarily in Asian cultures.  The number of people able to come up with large amounts of money has also increased with the rise of an affluent middle class in many Asian countries.

The poaching is also increasing because it’s very difficult to prevent it.  The rhinos live in a large, wild habitat.  It’s simply difficult and expensive to patrol and defend such a large region.  The poachers are very well armed because they are backed by international crime syndicates with deep pockets.  It’s a huge challenge for the governments involved to prevent the poaching from occurring.

This problem will likely continue to increase until the demand for the rhino horns starts to decrease.  Modern medical research has concluded that rhino horn has no medicinal value, but as long as people are willing to pay big money for them, someone will find a way to meet that demand.

As an interesting aside, theft of rhino horns from museums has also risen dramatically.  At least 30 horns were stolen from museums this past year.  Click here to learn more.

Bluff Collapse Releases Coal Ash

By ThinkReliability  Staff

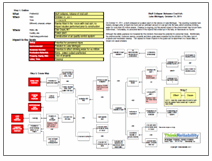
On October 31, 2011, a bluff collapsed at a power plant on the shores of Lake Michigan.  The resulting mudslide took trailers, storage units, at least one truck and an unknown amount of coal ash into the lake, which provides drinking water for more than 40 million people.  Cleanup is ongoing, but the overall impact to the environment has not yet been determined.  Fortunately, no personnel were in the objects that ended up in the lake, so there were no injures.

Although the safety goal was not impacted by this incident, there was the potential for personnel injury.  Additionally, the environmental, customer service, property and labor goals were impacted by the pollution of the lake, loss of property and necessary cleanup.  The causes for these impacts to the goals can be examined in a Cause Map, or visual root cause analysis.

The mudslide which took the objects and coal ash into the lake was caused by insufficient stability of a bluff overlooking the lake.  The bluff’s instability was caused by degraded ground material stability mixed with water and no vegetation.  The vegetation had been removed for construction.  The ground in the area had been filled with coal ash – a practice allowed in previous decades.  Coal ash is less stable than soil, especially when it is exposed to water.  In this case, aerial images suggest that the water seeped into the area from a high water table or from an unlined retention pond used to store storm water.  Although a construction project was ongoing, an environmental impact study – which may have unearthed concerns about the stability of the area – was not considered necessary.

Steps are being taken to clean up the lake to the extent possible.  However, concerns about coal ash in this area and others are prompting a review by Congress to determine how coal ash can be safely dealt with.  Many say this incident suggests that stronger controls are needed.

To view the Outline and Cause Map, please click “Download PDF” above.  Or click here to read more.