Tag Archives: environmental

Severe Flooding in Thailand

By ThinkReliability Staff

Thailand is experiencing an unusually heavy monsoon season, but it’s management of the rains that are being blamed for the most severe flooding to occur in the area in decades.  Heavy rains resulting from the monsoon season and high tides are creating serious difficulties for officials in the area, who are having to make hard choices with where to divert water and are essentially “sacrificing” certain towns because there’s nowhere else for the water to go.  One of these decisions ended in a gunfight.  Tensions are high, and people are busying themselves attempting to protect their homes and towns with hundreds of thousands of sandbags.

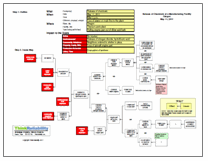
We can examine the issues contributing to the risk to people and property in a Cause Map, or visual root cause analysis.  First, we define the problem within a problem outline.  In the bottom portion of the outline, we capture the impacts to the country’s goals.  More than 200 people have been reported killed as a result of the floods, which are themselves an impact to the environmental goal.  If citizens can be considered customers, the decision to “sacrifice” some towns to save others can be considered an impact to the customer service goal.  The  property goal is impacted by the destruction of towns and the labor goal is impacted by the flood preparations and rescue missions required to protect the population.

Beginning with these goals and asking “Why” questions, we can diagram the cause-and-effect relationships that contribute to the impacts discussed above.  The decision to “sacrifice” some towns to save others is caused by flooding due to heavy monsoon rains and high tides, and the fact that water had to be directed towards some towns, as there is nowhere else for the water to go.  Towns have been built in catchments and areas designed to be reservoirs. Natural waterways have been dammed and diverted.  Dams are full because insufficient water was discharged earlier in the season due to a miscalculation of water levels. Canals have been filled in or are blocked with garbage.  Insufficient control of development in the area has led to insufficient control of water flow, and lack of areas for water to gather – without endangering towns.

Thailand officials are assisting with sandbags and building new flood barriers and drainage canals.  They’re admitting that this issue needs to be repaired.  According to the director of the National Disaster Warning Center, “If we don’t have integrated water management, we will face this problem again next year.”  Hopefully this is the first step in making changes that ensure loss of life and property is minimized during the annual rainy season.

To view the Outline and Cause Map, please click “Download PDF” above.  Or click here to read more


Spill Kills Hundreds of Thousands of Marine Animals

By ThinkReliability Staff

A recent fish kill is estimated to have killed hundreds of thousands of marine life – fish, mollusks, and even endangered turtles – and the company responsible is facing lawsuits from nearby residents and businesses affected by the spill causing the kill.  A paper mill experienced problems with its wastewater treatment facility (the problems have not been described in the media), resulting in the untreated waste, known as “black liquor”, being dumped in the river.  The waste has been described as being “biological” not chemical in nature; however, the waste reduced the oxygen levels in the river which resulted in the kill.

Although it’s likely that a spill of any duration would have resulted in some marine life deaths, the large number of deaths in this case are related to the length of time of the spill.  It has been reported that the spill went on for four days before action was taken, or the state was notified.  The company involved says that action, and reporting to the state, are based on test results which take several days.

Obviously, something needs to be changed so that the company involved is able to determine that a spill is occurring before four days have passed.  However, whatever actions will be taken are as of yet unclear.  The plant will not be allowed to reopen until it meets certain conditions meant to protect the river.  Presumably one of those conditions will be figuring out a method to more quickly discover, mitigate, and report problems with the wastewater treatment facility.

In the meantime, the state has increased discharge from a nearby reservoir, which is raising the water levels in the river and improving the oxygen levels.  The company is assisting in the cleanup, which has involved removing lots of stinky dead fish from the river.  The cleanup will continue, and the river will be stocked with fish, to attempt to return the area to its conditions prior to the spill.

This incident can be recorded in a Cause Map, or a visual root cause analysis.  Basic information about the incident, as well as the impact to the organization’s goals, are captured in a Problem Outline.  The impacts to the goals (such as the environment goal was impacted due to the large numbers of marine life killed) are used to begin the Cause Map.  Then, by asking “Why” questions, causes can be added to the right.  As with any incident, the level of detail is dependent on the impact to the goals.

To view the Outline and Cause Map, click “Download PDF” above.

Release of Chemicals at a Manufacturing Facility

By ThinkReliability Staff

A recent issue at a parts plant in Oregon caused a release of hazardous chemicals which resulted in evacuation of the workers and in-home sheltering for neighbors of the plant.  Thanks to these precautions, nobody was injured.  However, attempts to stop the leak lasted for more than a day.  There were many contributors to the incident, which can be considered in a root cause analysis presented as a Cause Map.

To begin a Cause Map, first fill out the outline, containing basic information on the event and impacts to the goals.  Filling out the impacts to the goals is important not only because it provides a basis for the Cause Map, but because goals may have been impacted that are not immediately obvious.  For example, in this case a part was lost.

Once the outline is completed, the analysis (Cause Map) can begin.  Start with the impacts to the goals and ask why questions to complete the Cause Map.  For example, workers were evacuated because of the release of nitrogen dioxide and hydrofluoric acid.  The release occurred because the scrubber system was non-functional and a reaction was occurring that was producing nitrogen dioxide.  The scrubber system had been tripped due to a loss of power at the plant, believed to have been related to switch maintenance previously performed across the street.Normally, the switch could be reset, but the switch was located in a contaminated area that could only be accessed by an electrician – and there were no electricians who were certified to use the necessary protective gear.  The reaction that was producing the nitrogen oxide was caused when a titanium part was dipped into a dilute acid bath as part of the manufacturing process.

When the responders realized they could not reset the scrubber system switch, they decided to lift the part out of the acid bath, removing the reaction that was causing the bulk of the chemicals in the release.  However, the hoist switch was tripped by the same issue that tripped the scrubber system.  Although the switch was accessible, when it was flipped by firefighters, it didn’t reset the hoist, leaving the part in the acid bath, until it completely dissolved.

Although we’ve captured a lot of information in this Cause Map, subsequent investigations into the incident and the response raised some more issues that could be addressed in a one page Cause Map.  The detail provided on a Cause Map should be commensurate with the impacts to the goals.  In this case, although there were no injuries, because of the serious impact on the company’s production goals, as well as the impact to the neighboring community, all avenues for improvement should be explored.

To view the Outline and Cause Map, please click “Download PDF” above.  Or click here to read more.

Record Flooding in Minot, ND

By ThinkReliability Staff

Record flooding has struck along the Souris River, leading to record-breaking flooding in Minot and threatening multiple other towns.  The river has widely ranging annual flow rates, varying from 4,200 acre feet to 2.1M acre feet.  Flooding is not uncommon in this part of the country, but what is striking about this case is how events upstream contributed so dramatically to what happened in Minot.

Rivers have always flooded.  Snowmelt and spring rains naturally contribute to higher flow rates.  Rivers also naturally move, as soil erodes in places and builds up in others.  As communities have developed near rivers, a need arose to control the rivers’ boundaries.  After all, you didn’t want to have your farm land constantly submerged by water.  Civilizations have been using earthen structures – like levees or dikes – for thousands of years to control the flow of water.

It was only within the last century, that extensive man-made levees have been built within the U.S.  The levees along the Mississippi River are some of the most elaborate in the world, extending 3,500 miles.  Along with levees, dams help to regulate the flow of water.  Dams can create artificial lakes used either to prevent flooding downstream or to provide a source of water for the community.

How is all of this relevant to the flooding in Minot?  A visual Cause Map can shed light on what led to the intense flooding there.  For starters, the levees meant to keep the Souris River contained were both overtopped and breeched.  This occurred because there was a high volume of water flowing downstream over an extended period of time.  Why is that?

The Souris River actually begins in Saskatchewan, where a further series of levees and dams controls the river.  Southern Canada had a significant amount of snowmelt and spring precipitation, saturating the soil and filling up local lakes and man-made reservoirs.  The area also had a heavy amount of rainfall the preceding the weekend, 4 to 7 inches.   With reservoirs already filled, officials had no choice but to increase dam flow rates to prevent flooding or worse – a burst dam.

While these complex levee and dam systems usually provide stability for riverside communities, they also can work against some of the systems that evolved in nature to keep water flow in check.  For instance, natural levees develop as rivers periodically overflow and deposit silt.  Also everglades and marshlands act like a sponge absorbing excess water.  Human development has affected these natural processes, and unfortunately there are likely to be many further effects from the flooding as the water continues down the Missouri River Basin.

Great Seattle Fire

By ThinkReliability Staff

On June 6, 1889, a cabinet-maker was heating glue over a gasoline fire.  At about 2:30 p.m., some of the glue boiled over and thus began the greatest fire in Seattle’s history.  We can look at the causes behind this fire in a visual root cause analysis, or Cause Map.  A thorough root cause analysis built as a Cause Map can capture all of the causes in a simple, intuitive format that fits on one page.

First we begin with the impacts to the goals.  There was one confirmed death resulting from the fire, and other fatalities resulting from the cleanup.  These are impacts to the safety goal.  The damage to the surrounding areas can be considered an impact to the environmental goal.  The fire-fighting efforts were insufficient; this can be considered an impact to the customer service goal.  Loss of water and electrical services is an impact to the production goal, the destruction of at least 25 city blocks is an impact to the property goal, and the rebuilding efforts are an impact to the labor goal.

Beginning with these impacted goals, we can lay out the causes of the fire.  The fire did so much damage because of the large area it covered.  It was able to spread over downtown Seattle because it continued to have the three elements required for fire – heat, fuel, and oxygen.  The heat was provided by the initial fire, oxygen by the atmosphere, and plenty of fuel with dry timber buildings.  The weather had been usually dry for the Pacific Northwest, and most of the downtown area had been built with cheap, abundant wood.

Additionally, fire fighters were unable to successfully douse the flames.  The all-volunteer fire department (most of whom reportedly quit after this fire) had insufficient water – hydrants were only placed at every other block, and the water pressure was unable to sustain multiple fire-fighting hoses.  Additionally, some of the water piping was also made of wood, and burned in the fire.  Firefighters attempted to pump water from the nearby bay, but their hoses were not long enough.

Before spreading across the city, the fire spread across the building where it began.  The fire began when glue being heated on a gasoline fire boiled over and lit.  The fire then began to burn the wood chips and turpentine spilled on the floor.  When the worker attempted to spray water at the fire, it only succeeded in spreading the lit turpentine, and thus the fire.  When firefighters arrived, the smoke was so thick that they were unable to find the source of the fire, and so it continued to burn.

The city of Seattle instituted many improvements as a result of this fire.  Wood burnings were banned in the district, and wood pipes were replaced.  A professional fire department was formed, and the city took over the distribution of water.  Possibly because of the vast improvements being made (and maybe because of the reported death of 1 million rats in the fire), the population of Seattle more than doubled in the year after the fire.

View the Cause Map by clicking on “Download PDF” above

Tornado Season of 2011: Worst Ever?

By ThinkReliability Staff

2011 is on pace to be the worst tornado season since record keeping began in 1950.  Communities nationwide have been affected this year, not just those in “Tornado Alley” where twisters are most commonly found.  The marked increase has many wondering just what is going on.  Is it simply greater media attention?  Or perhaps just bad luck this year?  Or maybe this is all because of global warming…

Weather experts agree that it is a combination of factors, but nothing out of the ordinary.  Weather is cyclical, and a higher number of deadly tornados than usual have touched down this year.  Currently 52 deadly tornados have already struck, compared with an annual average of 22.  Additionally these tornados happen to have stuck heavily populated areas.  As recent as April of this year, the EPA has stated that “to date, there is no long-term evidence of systematic changes in [thunderstorms and tornados] over the course of the past 100 years.”

However, some contend that the higher number of tornados must be tied to climate change.  They argue that all the extra energy being stored in the atmosphere is being “expressed in stronger winds…in stronger rainfall.”  How else would it be possible to explain the catastrophic natural phenomenon occurring the last few years?

This is where the Cause Mapping process can help focus all parties on solving the problem, instead of arguing or blaming.  The first step in the process is to define the issue by its impact to overall goals.  In this case, all parties can agree that the destruction and loss of life are the principle impacts.

The next step is to analyze the causes in a visual map.  A simple Cause Map can lay the foundation for a more detailed analysis, so a 5-Why map is usually the best starting point.  From there more causes can be added to the map; all possibilities should be included on the first draft.  When all possible causes are included, it focuses on team on brainstorming instead of debating.

Let’s take a closer look at why so many tornados have hit densely populated areas.  There are primary four reasons identified in the Cause Map.  First, there have been more tornados.  This could be because more are being counted, due to better weather tracking capabilities, or because there simply are more occurring.  Second, there are more forceful tornados than usual.  This could be related to more supercell thunderstorms, since most tornados spring from these types of weather systems.  Because this isn’t known for sure, a question mark indicates that more evidence is needed to support or disprove this hypothesis.  Likewise, it’s possible more strong weather systems are being caused by global warming.

Instead of stopping the analysis to debate global warming, it’s most productive to continue exploring why tornados are touching down in population centers.  It’s not simply a function of the tornados.  There also happen to be more people near where tornados are, and there are more structures which are susceptible to tornado damage.

More people are near where the tornados are because there are more people.  While this is straightforward, it’s often overlooked in the debate and is precisely a reason why more people would perish in a tornado.  People might also be in the area because they have little time to evacuate or take appropriate shelter, unlike in a hurricane.  Advance warning averages just 11 minutes.

Despite many advances in Doppler radar technology and satellite data, tornados are still generally detected the old fashioned way.  Today, a web of 290,000 trained volunteers, called SKYWARN, provide severe weather alert information to the National Weather Service.  Since its inception in the 1970s, SKYWARN has helped the NWS to issue more timely and accurate severe weather warnings.  The NOAA’s National Severe Storms Lab is looking to improve that advanced warning time to 20 minutes, so this might be a possible solution to reducing the number of deaths and injuries caused by tornados.

The fourth factor is that people tend to be located in buildings which are highly susceptible to tornado damage.  More Americans are living in manufactured or modular homes than in previous decades.  As of 2009, there were 8.7 million mobile homes in the United States.  Mobile homes account for nearly half of tornado fatalities.  When other factors are normalized, the data shows unequivocally that mobile homes are more likely to sustain catastrophic damage during tornados.  Some states have begun to take steps to improve the building codes for such dwellings and also to require hardened shelters at mobile home sites.

As even this fairly simple Cause Map demonstrates, there are many factors contributing to this season’s frightening weather.  Focusing on a single cause can mask the many reasons required to produce an effect, and in the end only limits productive debate.

Chicago Plans for a Warmer Future

By Kim Smiley

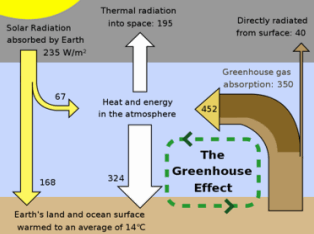
The very existence of climate change continues to be controversial, but some cities have already decided to start preparing for a hotter future.  While the rest of the world continues to debate whether man’s impact on the world is producing climate change, the city of Chicago is already taking action to prepare for a warmer climate.

The effort to adapt Chicago to the predicted climate of the future began in 2006 under the then mayor Richard M. Daley.   The first step in the process was a model that was created by scientists specializing in climate change to predict how global warming would affect Chicago.  The output of the model shocked city planners.  Experts predicted that summers in Chicago would be like current summers in the Deep South, with as many as 72 days over 90 degrees by the end of the century.  A private risk assessment firm was tasked to determine how the predicted climate shift would impact the city.  The dire predictions included an invasion of termites, heat-related deaths reaching 1,200 a year and billions of dollars’ worth of deterioration to building and infrastructure in the city.  Chicago decided the time to take action was now.

Created by Robert A. Rohde as part of the Global Warming Art project.

Armed with the predictions, city planners began to plan how best to adapt Chicago for the warmer future.  There are a number of ways that Chicagoans are already changing how they maintain the city.  Much attention has been given to the paved spaces in the city to improve drainage to accommodate higher levels of predicted rain.  13,000 concrete alleys in Chicago were originally built without drainage and city planners are working to change this.  150 alleys have already been remade with permeable pavers that allow 80 percent of rainwater to filter to the ground below.  City planners are also changing the mix of trees that are planted to make sure they are selecting varieties that can withstand hotter temperatures.  Air conditioning is also being planned for Chicago’s public schools, which have been heated but not air conditioned until now.

Time will tell whether the steps Chicago is taking will prove necessary, but the Chicago’s adaption strategy is an interesting case study in a nation still debating the existence of global warming.

When trying to select the best solutions to a problem such as in this case, the Cause Mapping method of root cause analysis can be an effective way to organize all the information.  A Cause Map detailing the many causes of a problem may make it easier to select the most cost effective and efficient means of preventing a problem.  A Cause Map can also be adapted to fit the scope of the problem.  In this example, a Cause Map could be built to detail the issue of preparing Chicago for a warmer future or a bigger Cause Map could be built to tackle the problem of global warmer on a larger scale.

To read more about the Chicago Climate Action Plan, please visit their website.

Nuclear Waste Stalemate in US

By Kim Smiley

America’s 104 commercial nuclear reactors produce about 2,000 metric tons of spent nuclear fuel each year.  The United States currently has no long term solution in place to deal with spent nuclear fuel.  The end result of this stalemate is that that there is more than 75,000 tons of spent nuclear fuel at 122 temporary sites in 39 states with nowhere to go.

Much of the nation’s spent fuel is currently stored in pools near operating nuclear reactors or near sites where reactors once were. Recent events at the Fukushima nuclear plant in Japan have sparked discussion about the potential safety risk of having so much fuel stored near operating reactors creating a situation where one single event can trigger a larger release of radiation.  To make things more complicated, storage pools at US plants are more heavily loaded than the ones at the Fukushima reactors.  Additionally, the pools will reach capacity at some point in the not so distant future and the fuel will have to be moved if the US plans to continue operating nuclear reactors.

How did we get in this situation?  The problem of no long term solution for spent nuclear fuel can be analyzed by building a Cause Map.  A Cause Map is a visual root cause analysis that lays out the causes that contribute to a problem in an intuitive, easy to understand format. Click on “Download PDF” above to view a high level Cause Map of this issue.

Looking at the Cause Map, it’s apparent one of the causes of this problem is that the plan for the Yucca Mountain Nuclear Waste Repository was canceled without an alternative plan being created.  Yucca Mountain Repository was planned to be a deep geological repository where nuclear waste would be stored indefinitely, shielded and packaged to prevent any release of radiation.  The Yucca Mountain Repository was canceled in 2009 for a number of reasons, some technological and some political.  Environmentalists and residents near the planned site were very vocal about their opposition to the selection of Yucca Mountain site for the nation’s repository.

A Blue Ribbon Commission of experts appointed by President Obama recently presented their recommendations of how to approach this problem.  Their proposal was to develop one or more sites where spent reactor fuel could be stored in above ground steel and concrete structures.  These structures could contain fuel for decades, allowing time for a more permanent solution to be developed.  These structures would not require any cooling beyond simple circulation of air and they could be stored at locations deemed safe, with the lowest risk of earthquakes and other disasters.  Hopefully the recommendations by the commission are the first step to solving this problem and developing a safe long term storage solution to the nation’s nuclear waste.

The Side Effects of Fracking: Explosive Water?

By ThinkReliability Staff

America’s push for clean energy has certainly been a source of intense debate – the safety of off-shore drilling, the hidden costs of ethanol subsidies, even the aesthetics of wind farms.  New evidence is set to increase the intensity on yet another topic – the debate over hydraulic fracturing.

Hydraulic fracturing is a process where internal fluid pressure is used to extend cracks, or fractures, into a rock formation.  It can occur in nature, but in man-made operations fractures are made deep in the earth by pumping fluid (mostly water) and a proppant (such as sand) out the bottom of a well.  The proppant prevents the fracture from closing back up after the injection of fluid stops.  Chemicals are sometimes added to the pumping fluid to aid in the process.  These fractures allow the gas or liquid trapped in the rock formation to flow back through the fracture, up the well and out for production.

More commonly known as “fracking”, the technique is used to release natural gas from shale rock formations.  These formations, especially common on the East Coast and in Canada, have provided thousands of new, well-paying jobs.  Fracking has allowed natural gas companies to access enormous reserves of natural gas, previously thought inaccessible and prohibitively expensive to drill.  In fact fracking has allowed drillers to tap what is potentially the world’s largest known reserve of natural gas in the Marcellus and Utica shale deposits, stretching from New York to Georgia.

As with any new technology however, there are potential consequences.  Lawmakers and regulators have debated the safety of the largely unregulated fracking industry, but with little definitive evidence either way…until now.  A study by Duke University has concluded that fracking does indeed lead to methane contamination in drinking water.  Methane is the primary component in natural gas and is not lethal to consume.  However, high concentrations are explosive.

The study determined that fracking causes methane to leak into drinking water.  Water sources within a kilometer were found to have significant levels of methane, more than 17 times higher than wells located further from drilling sites.  Furthermore, it was determined that the source of the methane was the much older methane released from the bedrock, versus newer methane produced naturally in the environment.

The exact reason for this is unclear, but a Cause Map can lay out the possible areas needing further investigation.  For instance, the frack chemicals might enter the water supply accidentally during the drilling process.  Spills could also contaminate surface water, or chemicals could migrate into the water supply.

The study indicates that chemical migration is most likely what’s happening.  Surface spills, which have happened, are not a major contributor to the wide-spread methane contamination; so that cause can be left in the Cause Map but won’t be investigated further for our purposes.  Furthermore, the study produced no evidence that the drilling process itself was causing the contamination; so that block can be crossed off the Cause Map.

That leaves one possibility – migration.  The chemicals (including methane) could migrate in two different ways – through the well casing or through the bedrock.  The study’s authors felt it was unlikely that chemicals were migrating thousands of feet through bedrock, so migration from well casings experiencing high pressure flow  is more probable.  While more evidence is needed, it is possible that the well casings are weakened by the fracking process which pushes sand through the casings at high pressure.

An EPA study looks to definitively determine fracking’s impact on drinking water, and specifically human health.  However that study is not scheduled to be completed until 2014.  Until then, lawsuits and tighter regulations are likely to dominate headlines.

San Francisco’s Stinking Sewers

By ThinkReliability Staff

The Golden Gate City is well known for its ground-breaking, environmentally-friendly initiatives.  In 2007 San Francisco outlawed the use of plastic bags at major grocery stores.  The city also mandated compulsory recycling and composting programs in 2009.  Both ordinances were the first laws of their kind in the nation, and criticized by some for being overly aggressive.  Likewise San Francisco’s latest initiative, to reduce city water usage by encouraging the use of low-flow toilets, has faced harsh criticism.

Recently San Francisco began offering substantial rebates to homeowners and businesses to install high efficiency toilets (HETs).  These types of toilet use 1.28 gallons or less per flush, down from the 1.6 gpf versions required today by federal law and even older 3.4 gpf toilets from decades ago.  That means that an average home user will save between 3,800 to 5,000 gallons of water per year per person.  In dollars, that’s a savings of $90 annually for a family of four.  This can quickly justify the cost of a new commode, since a toilet is expected to last 20 years.

Aside from cost savings, there are obvious environmental benefits to reduced water use.  The city initially undertook the HET rebate initiative to decrease the amount of water used overall by the city and the amount of wastewater requiring treatment.  They were successful, and water usage decreased.  In fact, the city’s Public Utilities Commission stated that San Francisco residents reduced their water consumption by 20 million gallons of water last year.  San Francisco last year used approximately 215 million gallons per day.  This also met other goals the city had, such as reducing costs to consumers.  Unintentionally though, the HET rebate initiative impacted a different goal – Customer Service.

As shown on the associated Cause Map, reduced water flow had a series of other effects.  While water consumption – and presumably waste water disposal – shrank significantly, waste production has remained constant.  Despite $100M in sewage systems upgrades over the past five years, current water flow rates are not high enough to keep things moving through the system.  As a result sewage sludge builds up in sewer lines.  As bacteria eat away at the organic matter in the sludge, hydrogen sulfide is released.  Hydrogen sulfide is known for its characteristic “rotten egg” smell.

This creates an unfortunate situation.  No one wants to walk through smelly streets.  Further, slow sewage means a build-up of potential harmful bacteria.  However, everyone agrees San Francisco should strive to conserve water.  Water is a scarce and increasingly expensive resource in California.  What’s the next step in solving the stinking sewer problem?

San Francisco is not the first city to deal with this issue.  There is substantial debate over the city’s current plan to purchase $14M in bleach to clean up the smell.   Many parties are concerned about potential environmental impacts and potential contamination to drinking water.  Other solutions have been proposed by environmental activists, but may have financial ramifications.

Cause Maps can help all parties come to agreement because they focus problem solvers on the goals, not the details of the problem.  In this case, all parties are trying to protect the environment and reduce costs to city residents.  Based on those goals and the Cause Map, potential solutions have been developed and placed with their corresponding causes.  The next step is to proactively consider how these new actions might affect the stakeholders’ goals.  Perhaps other goals could be impacted, such as the safety of drinking water and potential contamination of San Francisco Bay.  Financial goals will surely be impacted to varying degrees with each solution.  Revising the Cause Map can help identify the pros and cons of each approach and narrow down which solution best satisfies all parties.