Tag Archives: Cause Mapping

City Facing Default

By ThinkReliaiblity Staff

A small Rhode Island town is on the brink of financial disaster.  A low tax basis and mounting liabilities are leaving Central Falls with few options short of filing for bankruptcy protection.   The town has requested financial assistance from state and federal governments and is begging pensioners to accept lower benefits.  But how did they get to this point, and what can be done to keep neighboring towns – and the state itself – from bankruptcy?  A Cause Map visually shows how this occurred.

Like other towns facing financial difficulty, Central Falls accepted more debt than they are now able to pay.  This two-fold reason is at the center of the Cause Map.  All of the effects Central Falls now faces – such as closed town services and the loss of local jobs – stem from the fact that the city had to cut spending.  The city had to cut spending because it is facing bankruptcy.  The Cause Map method allows us to trace the reasons back even further and build a complete picture.

The first piece is that the town has a large debt – $80M to be exact – in pension liabilities for its 214 city police officers and fire fighters; this is in addition to $25M in budget deficits over the next five years.  The generous pensions can be traced back to two state laws regarding public worker negotiations.  Rhode Island is one of the few states that allows workers unlimited collective bargaining, meaning that workers can negotiate for a higher salary for any reason.  Without any limits, talks often broke down.  When talks broke down arbitrators stepped in, and their decisions were binding.  In past years, arbitrators often settled on benefits that were comparable to surrounding towns instead of what the city could actually afford.  Unlimited collective bargaining and binding arbitration together contributed to the poor negotiations and overly-generous benefits.

The second piece is that the town doesn’t have a large income.  It has a small tax basis since the median family income is only around $33,000.  Other sources of income have been pulled back as well – like state and federal funding.  The state is facing similar issues, and is in no place to bail out the multiple municipalities at risk.  The federal government had extended aid, but rescinding it when Central Fall’s credit rating was downgraded by Moody’s.

Municipal bankruptcy is a rare occurrence, with fewer than 50 occurring in the last 3 decades nationwide.  State bankruptcy is practically unheard of.  Arkansas was the last to default on its bonds, following the Great Depression.  This is in part to bankruptcy laws put in place after to avoid such an occurrence.  When one town goes bankrupt, neighboring communities are often negatively affected.  The resulting domino effect could be disastrous.  Rhode Island is a small state with little room to maneuver if local towns – like Central Falls – start going bankrupt.

Potential Power of Solar Flares

By Kim Smiley

The largest solar flare in recorded history occurred on September 1, 1859.  As the energy released from the sun hit the earth’s atmosphere, the skies erupted in a rainbow of colored auroras that were visible as far south as Jamaica and Hawaii.  The most alarming consequences of this “Carrington Event” (named for solar astronomer Richard Carrington who witnessed it) were its effect on the telegraph system. Operators were shocked and telegraph paper caught fire.

No solar flares approaching the magnitude of the Carrington Event have occurred since, but the question must be asked – What if a similarly sized solar flare happened today?

There is some debate on how severe the consequences would be, but the bottom line is that modern technology would be significantly impacted by a large solar flare.  When large numbers of charged particles bombard the earth’s atmosphere (as occurs during a large solar flare), the earth’s magnetic field is deformed.  A changing magnetic field will induce current in wires that are inside it resulting in large currents in electrical components within the earth’s atmosphere during a solar fare.

Satellites would likely malfunction, taking with them wireless communication, GPS capabilities and other technologies.  This would severely impact the modern world, but the largest impact would likely be to the power grid.  There is debate on how long power would be out and how severe the damage is, but it is clear that solar flares have the ability to significantly damage the power grid.  Solar flares much smaller than the Carrington Event have caused blackouts, but power was returned relatively quickly.  One of the more impressive of these examples occurred in 1989 when the entire province of Quebec lost power for about 12 hours. (Click here to read more.)

NASA works to predict and monitor sun activity so that preventive actions can be taken to help minimize damage if a large solar flare occurs.  For example, portions of the power grid could be shut down to help protect against overheating.  Scientists continue to study the issue, working to improve predictions for sun flare activity and learn how to better protect technology from them.  Click the “Download PDF” button above to view a high level Cause Map, a visual root cause analysis, built for this issue.

More information can be found in a report by the National Academy of Sciences, Severe Space Weather Events–Understanding Societal and Economic Impacts and the NASA website.

Record Flooding in Minot, ND

By ThinkReliability Staff

Record flooding has struck along the Souris River, leading to record-breaking flooding in Minot and threatening multiple other towns.  The river has widely ranging annual flow rates, varying from 4,200 acre feet to 2.1M acre feet.  Flooding is not uncommon in this part of the country, but what is striking about this case is how events upstream contributed so dramatically to what happened in Minot.

Rivers have always flooded.  Snowmelt and spring rains naturally contribute to higher flow rates.  Rivers also naturally move, as soil erodes in places and builds up in others.  As communities have developed near rivers, a need arose to control the rivers’ boundaries.  After all, you didn’t want to have your farm land constantly submerged by water.  Civilizations have been using earthen structures – like levees or dikes – for thousands of years to control the flow of water.

It was only within the last century, that extensive man-made levees have been built within the U.S.  The levees along the Mississippi River are some of the most elaborate in the world, extending 3,500 miles.  Along with levees, dams help to regulate the flow of water.  Dams can create artificial lakes used either to prevent flooding downstream or to provide a source of water for the community.

How is all of this relevant to the flooding in Minot?  A visual Cause Map can shed light on what led to the intense flooding there.  For starters, the levees meant to keep the Souris River contained were both overtopped and breeched.  This occurred because there was a high volume of water flowing downstream over an extended period of time.  Why is that?

The Souris River actually begins in Saskatchewan, where a further series of levees and dams controls the river.  Southern Canada had a significant amount of snowmelt and spring precipitation, saturating the soil and filling up local lakes and man-made reservoirs.  The area also had a heavy amount of rainfall the preceding the weekend, 4 to 7 inches.   With reservoirs already filled, officials had no choice but to increase dam flow rates to prevent flooding or worse – a burst dam.

While these complex levee and dam systems usually provide stability for riverside communities, they also can work against some of the systems that evolved in nature to keep water flow in check.  For instance, natural levees develop as rivers periodically overflow and deposit silt.  Also everglades and marshlands act like a sponge absorbing excess water.  Human development has affected these natural processes, and unfortunately there are likely to be many further effects from the flooding as the water continues down the Missouri River Basin.

Deadly E.Coli Outbreak from Sprouts

By Kim Smiley

Since May, at least 31 people have died and nearly 3,000 have been sickened from E.coli infections in Europe in one of the widest spread and deadliest E.coli outbreaks in recent memory.  After days of confusion, German authorities determined that the source of the contamination is sprouts from an organic farm in northern Germany. The farm has suspended sale of produce and won’t reopen until it is determined safe.

This issue can be investigated by creating a Cause Map, an intuitive format for performing a root cause analysis.  In a Cause Map, the causes contributing to an incident are determined and organized by cause-and-effect relationships.  To view a high level Cause Map of this incident, please click on “Download PDF” above.

This investigation is still underway and additional information can easily be added to the Cause Map as it becomes available. The initial source of contamination at the farm had not yet been determined, but sprouts are known have a high risk of carrying dangerous bacteria.

Sprouts are considered to be a high risk food for a number of reasons.  The seeds are often grown in countries with less stringent inspection criteria so they can arrive at growers already contaminated. Seeds can be contaminated in any number of ways.  E. coli live in the gut of mammals so any time animals or animal waste are near sprout seeds there is a chance of contamination.

It can also be difficult to sanitize the seeds.  Bacteria can hide inside damaged seeds and be missed during sanitizing steps.  Sprouts are also grown in warm water, ideal conditions for growing bacteria as well.  Another factor to consider is that many people eat sprouts raw; cooking would kill any bacteria that were present.

Sprouts have been the source of many bacteria outbreaks in the past.  The U.S. has had at least 30 reported outbreaks related to sprouts in the last 15 years.  Sprouts are associated with enough risk that the Food and Drug Administration has issued warnings for those at high risk, (children, the elderly, pregnant women and people with compromised immune systems) to avoid eating raw sprouts.  If you fall into the high risk category or are just feeling nervous after recent events, the easiest way to prevent bacterial infection from sprouts is to cook them.

Changing the Emergency Response Process

By ThinkReliability Staff

When Line 132 ruptured last September in the community of San Bruno, California, emergency personnel were quick to respond to the natural gas explosion.  The first fire truck was on scene within six minutes of the explosion.  What responders found was a chaotic scene, with multiple wounded and killed and swaths of the neighborhood in flames or simply flattened.  Little did they know that a large natural gas transmission line, feeding the spreading fire, was directly beneath them.  Emergency personnel did their best to clear homes and evacuate the wounded as the fire spread, but the confusion continued for nearly 90 minutes until the gas valves were shut off upstream from the fire.

The subsequent National Transportation Safety Board (NTSB) investigations focused on Pacific Gas and Electric (PG&E) processes following the accident, and found that PG&E was woefully unable to respond quickly to a crisis of this magnitude.  As a set of timelines show, emergency response personnel were already on scene long before PG&E was even aware that a pipeline rupture may be associated with a local fire.  PG&E apparently did not notice an alarm warning them of a pressure drop.  Control systems detected a severe pressure drop approximately four minutes after the disruption; however the PG&E gas control center, located in San Francisco, remained unaware of the explosion and fire until a PG&E dispatch center in Concord called them.  Off duty employees had called-in to the Concord dispatch center 7 and 11 minutes after the incident, alerting them of a large fire in San Bruno.  However it was not until the dispatch center called the gas control center 16 minutes after the explosion that gas control operators realized what was happening.  By this point emergency responders had already arrived at the scene, unaware of the large natural gas pipeline directly under the neighborhood.

What information did emergency responders have as they arrived on scene that day?  Although PG&E itself was aware of the likely service disruption, they failed to notify first responders of any potential danger in those critical minutes after the explosion.  Additionally according to NTSB testimony, the fire department was unaware of the large natural gas pipeline under the community.  Larger transmission pipelines have different operating characteristics than smaller distribution pipelines, including different recommended safety precautions and shut down times.  With a better awareness of the pipeline locations and associated dangers, emergency response personnel could have developed training and response procedures ahead of time for an explosion of this magnitude.  PG&E has since taken steps to enhance its partnership with first responders and other public safety organizations.  Clearly there are other steps that need to be taken as well.

When conducting an investigation, a timeline can be a helpful tool to organize information.  While straightforward to build, timelines can identify areas needing more research and aid in building a process map and a Cause Map.  Compare what happened at PG&E to what emergency responders were doing.  You’ll notice there was a significant delay at PG&E in recognizing there was a problem and then acting upon it.  It took nearly 90 minutes to close valves to shut transmission lines.  Changes must be made to speed up PG&E’s procedures in a crisis situation.

Likewise process maps are a useful tool for determining where a process can use improvement.  In the Current process map, it is noticeable that there are three parallel processes occurring, where information is not being shared in an efficient manner.  The PG&E Dispatch Center only shares information with the Emergency Dispatch Center after they have fully assessed the situation.  This information might come after the fact, as it did in San Bruno, or seriously delay an effective response by EMTs and firefighters.  Going one step further, trained emergency personnel might be able to check with local utilities if they have reason to suspect a natural gas pipeline is involved.  Simple procedural changes, such as who is notified and when, can have significant impacts.

It is important to note that the timeline helps create the most accurate “As Occurred” process map (called Current in this case).  Procedures can differ from actual processes, so it is important to document what actually happened, identify differences in what should have occurred, and figure out why it didn’t.  In this case, PG&E’s procedures were followed and need to be revised.

The NTSB recommendations will undoubtedly lead to multiple changes.  It is easy to focus on material solutions, which tend to be expensive to implement.  Some changes under consideration are the use of remote controlled valves and the replacement of aging pipes.  While there is no doubt that these changes need to happen, other changes can help in the meantime.  Process maps can help identify procedural changes which may be much less expensive, such a modifying notification procedures.

A detailed Cause Map built after the preliminary investigation shows what NTSB investigators believe led the natural gas leak.  More information on the NTSB investigation can be found here.

Great Seattle Fire

By ThinkReliability Staff

On June 6, 1889, a cabinet-maker was heating glue over a gasoline fire.  At about 2:30 p.m., some of the glue boiled over and thus began the greatest fire in Seattle’s history.  We can look at the causes behind this fire in a visual root cause analysis, or Cause Map.  A thorough root cause analysis built as a Cause Map can capture all of the causes in a simple, intuitive format that fits on one page.

First we begin with the impacts to the goals.  There was one confirmed death resulting from the fire, and other fatalities resulting from the cleanup.  These are impacts to the safety goal.  The damage to the surrounding areas can be considered an impact to the environmental goal.  The fire-fighting efforts were insufficient; this can be considered an impact to the customer service goal.  Loss of water and electrical services is an impact to the production goal, the destruction of at least 25 city blocks is an impact to the property goal, and the rebuilding efforts are an impact to the labor goal.

Beginning with these impacted goals, we can lay out the causes of the fire.  The fire did so much damage because of the large area it covered.  It was able to spread over downtown Seattle because it continued to have the three elements required for fire – heat, fuel, and oxygen.  The heat was provided by the initial fire, oxygen by the atmosphere, and plenty of fuel with dry timber buildings.  The weather had been usually dry for the Pacific Northwest, and most of the downtown area had been built with cheap, abundant wood.

Additionally, fire fighters were unable to successfully douse the flames.  The all-volunteer fire department (most of whom reportedly quit after this fire) had insufficient water – hydrants were only placed at every other block, and the water pressure was unable to sustain multiple fire-fighting hoses.  Additionally, some of the water piping was also made of wood, and burned in the fire.  Firefighters attempted to pump water from the nearby bay, but their hoses were not long enough.

Before spreading across the city, the fire spread across the building where it began.  The fire began when glue being heated on a gasoline fire boiled over and lit.  The fire then began to burn the wood chips and turpentine spilled on the floor.  When the worker attempted to spray water at the fire, it only succeeded in spreading the lit turpentine, and thus the fire.  When firefighters arrived, the smoke was so thick that they were unable to find the source of the fire, and so it continued to burn.

The city of Seattle instituted many improvements as a result of this fire.  Wood burnings were banned in the district, and wood pipes were replaced.  A professional fire department was formed, and the city took over the distribution of water.  Possibly because of the vast improvements being made (and maybe because of the reported death of 1 million rats in the fire), the population of Seattle more than doubled in the year after the fire.

View the Cause Map by clicking on “Download PDF” above

Tornado Season of 2011: Worst Ever?

By ThinkReliability Staff

2011 is on pace to be the worst tornado season since record keeping began in 1950.  Communities nationwide have been affected this year, not just those in “Tornado Alley” where twisters are most commonly found.  The marked increase has many wondering just what is going on.  Is it simply greater media attention?  Or perhaps just bad luck this year?  Or maybe this is all because of global warming…

Weather experts agree that it is a combination of factors, but nothing out of the ordinary.  Weather is cyclical, and a higher number of deadly tornados than usual have touched down this year.  Currently 52 deadly tornados have already struck, compared with an annual average of 22.  Additionally these tornados happen to have stuck heavily populated areas.  As recent as April of this year, the EPA has stated that “to date, there is no long-term evidence of systematic changes in [thunderstorms and tornados] over the course of the past 100 years.”

However, some contend that the higher number of tornados must be tied to climate change.  They argue that all the extra energy being stored in the atmosphere is being “expressed in stronger winds…in stronger rainfall.”  How else would it be possible to explain the catastrophic natural phenomenon occurring the last few years?

This is where the Cause Mapping process can help focus all parties on solving the problem, instead of arguing or blaming.  The first step in the process is to define the issue by its impact to overall goals.  In this case, all parties can agree that the destruction and loss of life are the principle impacts.

The next step is to analyze the causes in a visual map.  A simple Cause Map can lay the foundation for a more detailed analysis, so a 5-Why map is usually the best starting point.  From there more causes can be added to the map; all possibilities should be included on the first draft.  When all possible causes are included, it focuses on team on brainstorming instead of debating.

Let’s take a closer look at why so many tornados have hit densely populated areas.  There are primary four reasons identified in the Cause Map.  First, there have been more tornados.  This could be because more are being counted, due to better weather tracking capabilities, or because there simply are more occurring.  Second, there are more forceful tornados than usual.  This could be related to more supercell thunderstorms, since most tornados spring from these types of weather systems.  Because this isn’t known for sure, a question mark indicates that more evidence is needed to support or disprove this hypothesis.  Likewise, it’s possible more strong weather systems are being caused by global warming.

Instead of stopping the analysis to debate global warming, it’s most productive to continue exploring why tornados are touching down in population centers.  It’s not simply a function of the tornados.  There also happen to be more people near where tornados are, and there are more structures which are susceptible to tornado damage.

More people are near where the tornados are because there are more people.  While this is straightforward, it’s often overlooked in the debate and is precisely a reason why more people would perish in a tornado.  People might also be in the area because they have little time to evacuate or take appropriate shelter, unlike in a hurricane.  Advance warning averages just 11 minutes.

Despite many advances in Doppler radar technology and satellite data, tornados are still generally detected the old fashioned way.  Today, a web of 290,000 trained volunteers, called SKYWARN, provide severe weather alert information to the National Weather Service.  Since its inception in the 1970s, SKYWARN has helped the NWS to issue more timely and accurate severe weather warnings.  The NOAA’s National Severe Storms Lab is looking to improve that advanced warning time to 20 minutes, so this might be a possible solution to reducing the number of deaths and injuries caused by tornados.

The fourth factor is that people tend to be located in buildings which are highly susceptible to tornado damage.  More Americans are living in manufactured or modular homes than in previous decades.  As of 2009, there were 8.7 million mobile homes in the United States.  Mobile homes account for nearly half of tornado fatalities.  When other factors are normalized, the data shows unequivocally that mobile homes are more likely to sustain catastrophic damage during tornados.  Some states have begun to take steps to improve the building codes for such dwellings and also to require hardened shelters at mobile home sites.

As even this fairly simple Cause Map demonstrates, there are many factors contributing to this season’s frightening weather.  Focusing on a single cause can mask the many reasons required to produce an effect, and in the end only limits productive debate.

Chicago Plans for a Warmer Future

By Kim Smiley

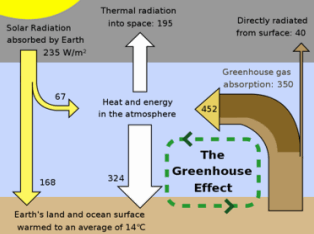
The very existence of climate change continues to be controversial, but some cities have already decided to start preparing for a hotter future.  While the rest of the world continues to debate whether man’s impact on the world is producing climate change, the city of Chicago is already taking action to prepare for a warmer climate.

The effort to adapt Chicago to the predicted climate of the future began in 2006 under the then mayor Richard M. Daley.   The first step in the process was a model that was created by scientists specializing in climate change to predict how global warming would affect Chicago.  The output of the model shocked city planners.  Experts predicted that summers in Chicago would be like current summers in the Deep South, with as many as 72 days over 90 degrees by the end of the century.  A private risk assessment firm was tasked to determine how the predicted climate shift would impact the city.  The dire predictions included an invasion of termites, heat-related deaths reaching 1,200 a year and billions of dollars’ worth of deterioration to building and infrastructure in the city.  Chicago decided the time to take action was now.

Created by Robert A. Rohde as part of the Global Warming Art project.

Armed with the predictions, city planners began to plan how best to adapt Chicago for the warmer future.  There are a number of ways that Chicagoans are already changing how they maintain the city.  Much attention has been given to the paved spaces in the city to improve drainage to accommodate higher levels of predicted rain.  13,000 concrete alleys in Chicago were originally built without drainage and city planners are working to change this.  150 alleys have already been remade with permeable pavers that allow 80 percent of rainwater to filter to the ground below.  City planners are also changing the mix of trees that are planted to make sure they are selecting varieties that can withstand hotter temperatures.  Air conditioning is also being planned for Chicago’s public schools, which have been heated but not air conditioned until now.

Time will tell whether the steps Chicago is taking will prove necessary, but the Chicago’s adaption strategy is an interesting case study in a nation still debating the existence of global warming.

When trying to select the best solutions to a problem such as in this case, the Cause Mapping method of root cause analysis can be an effective way to organize all the information.  A Cause Map detailing the many causes of a problem may make it easier to select the most cost effective and efficient means of preventing a problem.  A Cause Map can also be adapted to fit the scope of the problem.  In this example, a Cause Map could be built to detail the issue of preparing Chicago for a warmer future or a bigger Cause Map could be built to tackle the problem of global warmer on a larger scale.

To read more about the Chicago Climate Action Plan, please visit their website.

Nuclear Waste Stalemate in US

By Kim Smiley

America’s 104 commercial nuclear reactors produce about 2,000 metric tons of spent nuclear fuel each year.  The United States currently has no long term solution in place to deal with spent nuclear fuel.  The end result of this stalemate is that that there is more than 75,000 tons of spent nuclear fuel at 122 temporary sites in 39 states with nowhere to go.

Much of the nation’s spent fuel is currently stored in pools near operating nuclear reactors or near sites where reactors once were. Recent events at the Fukushima nuclear plant in Japan have sparked discussion about the potential safety risk of having so much fuel stored near operating reactors creating a situation where one single event can trigger a larger release of radiation.  To make things more complicated, storage pools at US plants are more heavily loaded than the ones at the Fukushima reactors.  Additionally, the pools will reach capacity at some point in the not so distant future and the fuel will have to be moved if the US plans to continue operating nuclear reactors.

How did we get in this situation?  The problem of no long term solution for spent nuclear fuel can be analyzed by building a Cause Map.  A Cause Map is a visual root cause analysis that lays out the causes that contribute to a problem in an intuitive, easy to understand format. Click on “Download PDF” above to view a high level Cause Map of this issue.

Looking at the Cause Map, it’s apparent one of the causes of this problem is that the plan for the Yucca Mountain Nuclear Waste Repository was canceled without an alternative plan being created.  Yucca Mountain Repository was planned to be a deep geological repository where nuclear waste would be stored indefinitely, shielded and packaged to prevent any release of radiation.  The Yucca Mountain Repository was canceled in 2009 for a number of reasons, some technological and some political.  Environmentalists and residents near the planned site were very vocal about their opposition to the selection of Yucca Mountain site for the nation’s repository.

A Blue Ribbon Commission of experts appointed by President Obama recently presented their recommendations of how to approach this problem.  Their proposal was to develop one or more sites where spent reactor fuel could be stored in above ground steel and concrete structures.  These structures could contain fuel for decades, allowing time for a more permanent solution to be developed.  These structures would not require any cooling beyond simple circulation of air and they could be stored at locations deemed safe, with the lowest risk of earthquakes and other disasters.  Hopefully the recommendations by the commission are the first step to solving this problem and developing a safe long term storage solution to the nation’s nuclear waste.

Gaming Network Hacked

By Kim Smiley

Gamers worldwide have been twiddling their thumbs for the last two weeks, after a major gaming network was hacked last month.  Sony, well known for its reputation for security, quickly shut down the PlayStation Network after it learned of the attacks, but not before 100+ million customers were exposed to potential identity theft.  Newspapers have been abuzz with similar high-profile database breaches in the last few weeks, but this one seems to linger.  The shut down has now prompted a Congressional inquiry and multiple lawsuits.  What went so wrong?

A Cause Map can help outline the root causes of the problem.  The first step is to determine how the event impacted company goals.  Because of the magnitude of the breach, there were significant impacts to customer service, property and sales goals.  The impact to Sony’s customer service goals is most obvious; customers were upset that the gaming and music networks were taken offline.  They were also upset that their personal data was stolen and they might face identity fraud.

However, these impacts changed as more information came to light and the service outage lingered.  Sony has faced significant negative publicity from the ongoing service outage and even multiple lawsuits.  Furthermore customers were upset by the delay in notification, especially considering that the company wasn’t sure if credit card information had been compromised as well.

As the investigation unfolded new evidence came to light about what happened.  This provided enough information to start building an in-depth Cause Map.  It turns out that network was hacked for three reasons.  Sony was busy fending off Denial of Service attacks, and simultaneously hackers (who may or may not have been affiliated with the DoS attacks) attempted to access the personal information database.  A third condition was required though.  The database had to actually be accessible to hack into, and unfortunately it was.

Why were hackers able to infiltrate Sony’s database?  At first, there was speculation that they may have entered Sony’s system through its trusted developer network.  It turns out that all the hackers needed to do was target the server software Sony was running.  That software was outdated and did not have firewalls installed.  With the company distracted, it was easy for hackers to breach their minimal defenses.

Most of the data that the hackers targeted was also unencrypted.  Had the data been encrypted, it would have been useless.  This raises major liability questions for the company.  To fend off both the negative criticism and lawsuits, Sony has been proactive about implementing solutions to protect consumers from identity fraud.  U.S. customers will soon be eligible for up to $1M in identity theft insurance.  However other solutions need to be implemented as well to prevent or correct other causes.  Look at the Cause Map; notice how that if you only correct issues related to fraud, there are still impacts without a solution.

Sony obviously needs to correct the server software and encryption flaws which let the hackers access customer’s data in the first place.  Looking to the upper branch of the Cause Map is also important, because the targeted DoS attack and possibly coordinated data breach jointly contributed to the system outage.  More detailed information on this branch will probably never become public, but further investigation might produce effective changes that would prevent a similar event from occurring.