Category Archives: Root Cause Analysis – Incident Investigation

Cause-and-Effect: Alcohol Consumption

By ThinkReliability Staff

The human body is a pretty amazing thing. Many of the processes that take place in our body on a regular basis – keeping us breathing, walking and playing video games or skydiving (or both, though hopefully not at the same time) – have not yet been replicated. They’re that complex.

Which of course raises a lot of questions: why do our bodies work the way they do? It also leads to the subset of questions, when x happens, why does y happen? If your question is, when I drink, why do I feel so great, then so lousy, science has the answers for you . . . and yes, we can capture them in a Cause Map!

If your goal for your body is to feel well and behave pretty consistently, then drinking alcohol is going to impact those goals. First, drinking is going to result in a decrease in control of your behavior. The specifics of how this manifest are legion, but I am assured you probably have many examples. Your post-binge feelings are also going to be impacted: most likely your drinking is going to result in a hangover (generally awful feelings centered around your abdomen and head), dehydration and frequent urination. If your goal is not to eat everything in sight without any consideration about what it will do to your waistline, then your diet may also be impacted due to a desire for carbohydrates.

Beginning with one of these goals, we can ask our favorite question: Why? For example, our decrease in behavior control results from the hypothalamus, pituitary gland, and cerebellum being depressed. This decreases inhibitions, ability to think clearly and also releases a whole slew of hormones and dopamine. Additionally, alcohol impacts neurotransmitters which direct emotions, actions and motor skills, so the combination may make you think you can dance on a table . . . but really you can barely walk.

Now about the ill after-effects. That lovely hangover results from your digestive system attempting to detoxify your body from alcohol and the pounding headache caused by dehydration. When your digestive system works to remove alcohol, the byproduct is acetaldehyde and your body doesn’t like it at all. Most of the alcohol from your body is going to be flushed through your bladder. In order to speed its exit, your body redirects all the liquid it can to your bladder, leaving you dehydrated. (That’s also why you have to run the bathroom so many times after drinking.) The whole process of removing alcohol from your body takes energy. In order to direct as much energy towards alcohol removal as possible, your brain shuts down most of your other functions (which doesn’t help with the ability to function). To get that energy back, your body craves food – carbs in particular (grease optional).

With all these bad effects, you may wonder why people drink at all. Well, when you drink, the alcohol depresses some systems as discussed above, resulting in the release of a bunch of hormones and dopamine. These make us feel good (or even fabulous!). That’s why we keep drinking. (There’s also a whole bunch of social pressures which I’m not going to go into here.)

Giving up drinking altogether is difficult, and many people don’t want to. There are, however, ways to minimize the ill effects of drinking. Food in your stomach helps absorb some of the alcohol, so eating before you drink can help. The headache portion of the hangover can be minimized by drinking a lot of water (though that won’t help with the frequent urination issue). AND OF COURSE, drinking does a number on your fine motor control and general behavior, you should never, ever drink and drive or operate other heavy machinery.

To view the Cause Map of what happens when you drink, click on “Download PDF” above. The information used to create this blog is from:

The Science of Getting Drunk” and

Every Time You Get Drunk This Is What Happens To Your Body And Your Brain

Deadly balcony collapse in Berkeley

By Kim Smiley

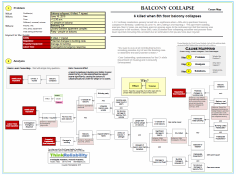
A 21st birthday celebration quickly turned into a nightmare when a fifth-story apartment balcony collapsed in Berkeley, California on June 16, 2015, killing 6 and injuring 7.  The apartment building was less than 10 years old and there were no obvious signs to the untrained eye that the balcony was unsafe prior to the accident.

The balcony was a cantilevered design attached to the building on only one side by support beams.  A report by Berkeley’s Building and Safety Division stated that dry rot had deteriorated the support beams significantly, causing the balcony to catastrophically fail under the weight of 13 bodies.

Dry rot is decay caused by fungus and occurs when wood is exposed to water, especially in spaces that are not well-ventilated. The building in question was built in 2007 and the extensive damage to the support beam indicates that there were likely problems with the water-proofing done during construction of the balcony.  Initial speculation is that the wood was not caulked and sealed properly when the balcony was built, which allowed the wood to be exposed to moisture and led to significant dry rot. However, the initial report by the Building and Safety Division did not identify any construction code violations, which raises obvious questions about whether the codes are adequate as written.

As a short-term solution to address potential safety concerns, the other balconies in the building were inspected to identify if they were at risk of a similar collapse so they could be repaired. As a potential longer-term solution to help reduce the risk of future balcony collapses in Berkeley as a whole, officials proposed new inspection and construction rules this week.  Among other things, the proposed changes would require balconies to include better ventilation and require building owners to perform more frequent inspections.  Only time will tell if proposed code changes will be approved by the Berkeley City Council, but something should be changed to help ensure public safety.

Finding a reasonable long-term solution to this problem is needed because balconies and porches are susceptible to rot because they are naturally exposed to weather.  Deaths from balcony failures are not common, but there have been thousands of injuries.  Since 2003, only 29 deaths from collapsing balconies and porches have been reported in the United States (including this accident), but an estimated 6,500 people have been injured.

Click on “Download PDF” above to see a Cause Map, a visual format of root cause analysis, of this accident.  A Cause Map lays out all the causes that contributed to an issue to show the cause-and-effect relationships.

Rollercoaster Crash Under Investigation

By ThinkReliability Staff

A day at a resort/ theme park ended in horror on June 2, 2015 when a carriage filled with passengers on the Smiler rollercoaster crashed into an empty car in front of it. The 16 people in the carriage were injured, 5 seriously (including limb amputations). While the incident is still under investigation by the Health and Safety Executive (HSE), information that is known can be collected in cause-and-effect relationships within a Cause Map, or visual root cause analysis.

The analysis begins with determining the impact to the goals. Clearly the most important goal affected in this case is the safety goal, impacted because of the 16 injuries. In addition to the safety impacts, customer service was impacted because of the passengers who were stranded for hours in the air at a 45 degree angle. The HSE investigation and expected lawsuits are an impact to the regulatory goal. The park was closed completely for 6 days, at an estimated cost of ?3 M. (The involved rollercoaster and others with similar safety concerns remain closed.) The damage to the rollercoaster and the response, rescue and investigation are impacts to the property and labor goals, respectively.

The Cause Map is built by laying out the cause-and-effect relationships starting with one of the impacted goals. In this case, the safety goal was impacted because of the 16 injuries. 16 passengers were injured due to the force on the carriage in which they were riding. The force was due to the speed of the carriage (estimated at 50 mph) when it collided with an empty carriage. According to a former park employee, the collision resulted from both a procedural and mechanical failure.

The passenger-filled carriage should not have been released while an empty car was still on the tracks, making a test run. It’s unclear what specifically went wrong to allow the release, but that information will surely be addressed in the HSE investigation and procedural improvements going forward. There is also believed to have been a mechanical failure. The former park employee stated, “Technically, it should be absolutely impossible for two cars to enter the same block, which is down to sensors run by a computer.” If this is correct, then it is clear that there was a failure with the sensors that allowed the cars to collide. This will also be a part of the investigation and potential improvements.

After the cause-and-effect relationships have been developed as far as possible (in this case, there is much information still to be added as the investigation continues), it’s important to ensure that all the impacted goals are included on the Cause Map. In this case, the passengers were stranded in the air because the carriage was stuck on the track due to the force upon it (as described above) and also due to the time required for rescue. According to data that has so far been released, it was 38 minutes before paramedics arrived on-scene, and even longer for fire crews to arrive with the necessary equipment to begin a rescue made very difficult by the design of the rollercoaster (the world record holder for most loops: 14). The park staff did not contact outside emergency services until 16 minutes after the accident – an inexcusably long time given the gravity of the incident. The delayed emergency response will surely be another area addressed by the investigation and continuing improvements.

Although the investigation is ongoing, the owners of the park are already making improvements, not only to the Smiler but to all its rollercoasters. In a statement released June 5, the owner group said “Today we are enhancing our safety standards by issuing an additional set of safety protocols and procedures that will reinforce the safe operation of our multi-car rollercoasters. These are effective immediately.” The Smiler and similar rollercoasters remain closed while these corrective actions are implemented.

Dr. Tony Cox, a former Health and Safety Executive (HSE) advisory committee chairman, hopes the improvements don’t stop there and issues a call to action for all rollercoaster operators. “If you haven’t had the accident yourself, you want all that information and you’re going to make sure you’ve dealt with it . . . They can just call HSE and say, ‘Is there anything we need to know?’ and HSE will . . . make sure the whole industry knows. That’s part of their role. It’s unthinkable that they wouldn’t do that.”

To view the information available thus far in a Cause Map, please click “Download PDF” above.

Make safeguards an automatic step in the process

By Holly Maher

On the morning of May 13, 2015, a parent was following his normal morning routine on his way to work.  He dropped off his older daughter at school and then proceeded to the North Quincy MBTA (Massachusetts Bay Transportation Authority) station where he boarded a commuter train headed to work.  When he arrived, approximately 35 minutes later, he realized that he had forgotten to drop off his one-year-old daughter at her day care and had left her in his SUV in the North Quincy station parking lot.  The frantic father called 911 as he boarded a train returning to North Quincy.  Thankfully, the police and emergency responders were able to find and remove the infant from the vehicle.  The child showed no signs of medical distress as a result of being in the parked car for over 35 minutes.

Had this incident resulted in an actual injury or fatality, I am not sure I would have had the heart to write about it.  However, because the impact was only a potential injury or fatality, I think there is great value in understanding the details of what happened and specifically how can we learn from this incident.  Unfortunately, this is not an isolated incident.  According to kidsandcars.org, an average of 38 children die in hot cars annually.  About half of those children were accidentally left in the vehicle by a parent, grandparent or caretaker.  While some people want to talk about these incidents using the terms “negligence” or “irresponsibility”, in the cases identified as accidental it is clear the parents were not trying to forget their children.  They often describe going into “autopilot” mode and just forgetting.  How many of us can identify with that statement?

On the morning this incident happened, the parent was following his typical routine.  After dropping off his older child at school, he went into “autopilot” and went directly to the North Quincy MBTA station, parked and left the vehicle to board the train.  His one-year-old daughter was not visible to him at that point because she was in the back seat of the vehicle in a rear facing car seat, as required by law.  Airbags were originally introduced in the 1970s but became more commercially available in the early 1990s.  In 1998, all vehicles were required to have airbags in both the driver and passenger positions.  This safety improvement, which has surely reduced deaths related to vehicle accidents, had the unintended consequence of putting children in car seats in a less visible position to the parents.  The number of hot car deaths has significantly increased since the early 1990s.

On the morning of the incident the ambient conditions were relatively mild, about 59 degrees Fahrenheit.  However, the temperature in a vehicle can quickly exceed the ambient conditions due to what is called the greenhouse effect.  Even with the windows down, the temperature in a vehicle can rise quickly.  80% of that temperature rise occurs within the first 10 minutes.

When the parent arrived at his destination, approximately 35 minutes later, he realized he had forgotten the infant and reboarded a train to return to the North Quincy station.  Thankfully, the parent also called 911 which expedited the rescue of the infant.  The time in the vehicle would obviously have been longer had he not called 911.

One other interesting detail about this incident is that the parent reported that he normally had a “safeguard” procedure that he followed to make sure this didn’t happen, but he didn’t follow it on this particular day.  It is unknown what the safeguard was or why it wasn’t followed.  This certainly makes an interesting point: we don’t follow safeguards when we know something is going to happen, we follow safeguards in case something happens.  As I told my daughter (who didn’t want to wear her seatbelt on the way from school to home because it “wasn’t that far”), you wear your seat belt not because you know you are going to get into an accident, you wear it in case you get into an accident.

The solutions that have been identified for this incident have been taken directly from kidsandcars.org.  They promote and encourage a consistent process to manage this risk not when you know you are going to forget, but in case you forget.  Consider placing something you need (phone, shoe, briefcase, purse) in the rear floor board so that you are required to open the rear door of the vehicle.  Always open the rear door when leaving your vehicle; this is called the “Look before you Lock” campaign.  Consider keeping a stuffed animal in the car seat; when the car seat is occupied, place the stuffed animal in the front seat as a visual cue/reminder that the child is in the car.  Consider implementing a process where the day care or caretaker calls if your child does not show up when expected.  This will minimize the amount of time the child might be left in the car.

For more information about this topic, visit kidsandcars.org.

Live anthrax mistakenly shipped to as many as 24 labs

By Kim Smiley

The Pentagon recently announced that live anthrax samples were mistakenly shipped to as many as 24 laboratories in 11 different states and two foreign countries.  The anthrax samples were intended to be inert, but testing found that at least some of the samples still contained live anthrax.  There have been no reports of illness, but more than two dozen have been treated for potential exposure.  Work has been disrupted at many labs during the investigation as testing and cleaning is performed to ensure that no unaccounted-for live anthrax remains.

The investigation is still ongoing, but the issues with anthrax samples appear to have been occurring for at least a year without being identified.  The fact that some of the samples containing live anthrax were transported via FedEx and other commercial shipping companies has heightened concern over possible implications for public safety.

Investigations are underway by both the Centers for Disease Control and the Defense Department to figure out exactly what went wrong and to determine the full scope of the problem. Initial statements by officials indicated that there may be problems with the procedure used to inactivate the anthrax.   Investigators so far have indicated that the work procedure was followed, but it may not have effectively killed 100 percent of the anthrax as intended.  Technicians believed that the samples were inert prior to shipping them out.

It may be tempting to call the issues with the work process used to inactivate the anthrax as the “root cause” of this problem, but in reality there is more than one single cause that contributed to this issue and more than one solution should be used to reduce the risk of future problems to acceptable levels.  Clearly, there is a problem if the procedure used to create inactive anthrax samples doesn’t kill all the bacteria present and that will need to be addressed, but there is also a problem if there aren’t appropriate checks and testing in place to identify that live anthrax remains in samples.  When dealing with potentially deadly consequences, a work process should be designed where a single failure cannot create a dangerous situation if possible.  An effective test for live anthrax prior to shipping the sample would have contained the problem to a single facility designed to handle live anthrax and drastically reduced the impact of the issue.  Additionally, an another layer of protection could be added by requiring that a facility receiving anthrax samples test them upon receipt and handle them with additional precautions until they were determined to be fully inert.

Building in additional testing does add time and cost to a work process, but sometimes it is worth it to identify small problems before they become much larger problems.  If issues with the process used to create inert anthrax samples were identified the first time it failed to kill all the anthrax, it could have been dealt with long before it was headline news and people were unknowingly exposed to live anthrax. Testing both before shipping and after receipt of samples may be overkill in this case, but something more than just working to fix the process for creating inert sample needs to be done because inadvertently shipping live anthrax for more than a year indicates that issues are not being identified in a timely manner.

6/4/2015 Update: It was announced that anthrax samples that are suspected of inadvertently containing live anthrax were sent to 51 facilities in 17 states, DC and 3 foreign countries (Australia, Canada and South Korea). Ten samples in 9 states have tested positive for live anthrax and the number is expected to grow as more testing is completed. 31 people have been preventative treated for exposure to anthrax, but there are still no reports of illness. Click here to read more.

Deadly Train Derailment Near Philadelphia

By Kim Smiley

On the evening of May 12, 2015, an Amtrak train derailed near Philadelphia, killing 8 and injuring more than 200.  The investigation is still ongoing with significant information about the accident still unknown, but changes are already being implemented to help reduce the risk of future rail accidents and improve investigations.

Data collected from the train’s onboard event recorder shows that the train sped up in the moments before the accident until it was traveling 106 mph in a 50 mph zone where the train track curved.  The excessive speed clearly played a role in the accident, but there has been little information released about why the train was traveling so fast going into a curve.  The engineer controlling the train suffered a head injury during the accident and has stated that he has no recollection of the accident. The engineer was familiar with the route and appears to have had all required training and qualifications.

As a result of this accident and the difficulty determining exactly what happened, Amtrak has announced that cameras will be installed inside locomotives to record the actions of engineers.  While the cameras may not directly reduce the risk of future accidents, the recorded data will help future investigations be more accurate and timely.

The excessive speed at the time of the accident is also fueling the ongoing debate about how trains should be controlled and the implementation of positive train control (PTC) systems that can automatically reduce speed.  There was no PTC system in place at the curve in the northbound direction where the derailment occurred and experts have speculated that one would have prevented the accident. In 2008, Congress mandated nationwide installation and operation of positive train control systems by 2015.  Prior to the recent accident, the Association of America Railroads stated that more than 80 percent of the track covered by the mandate will not have functional PTC systems by the deadline. The installation of PTC systems requires a large commitment of funds and resources as well as communication bandwidth that has been difficult to secure in some area and some think the end of year deadline is unrealistic. Congress is currently considering two different bills that would address some of the issues.  The recent deadly crash is sure to be front and center in their debates.

In response to the recent accident, the Federal Railroad Administration ordered Amtrak to submit plans for PTC systems at all curves where the speed limit is 20 mph less than the track leading to the curve for the main Northeast Corridor (running between Washington, D.C. and Boston).  Only time will tell how quickly positive train control systems will be implemented on the Northeast Corridor as well as the rest of the nation, and the debate on the best course of action will not be a simple one.

An initial Cause Map, a visual root cause analysis, can be created to capture the information that is known at this time.  Additional information can easily be incorporated into the Cause Map as it becomes available.  To view a high level initial Cause Map of this accident, click on “Download PDF”.

New Regulations Aim to Reduce Railroad Crude Oil Spills

By ThinkReliability Staff

The tragic train derailment in Lac-Mégantic, Quebec on July 6, 2013 (see our previous blog on this topic) ushered in new concerns about the transport of crude oil by rail in the US and Canada. Unfortunately, the increased attention has highlighted a growing problem: spills of crude oil transported via rail, which can result in fires, explosions, evacuations, and potentially deaths. (Luckily there have been no fatalities since the Lac-Mégantic derailment.) According to Steve Curwood of Living on Earth, “With pipelines at capacity the boom has lead a 4,000 percent increase in the volume of crude oil that travels by rail, and that brought more accidents and more oil spills in 2014 than over the previous 38 years.”

This follows a period of increases in railroad safety – according to the US Congressional Research Service, “From 1980 to 2012, railroads reduced the number of accidents releasing hazmat product per 100,000 hazmat carloads from 14 to 1.” From October 19, 2013 to May 6, 2015, there were at least 12 railcar derailments that resulted in crude oil spills. (To see the list of events, click on “Download PDF” and go to the second page.)

Says Sarah Feinberg, acting administrator of the Federal Railroad Administration (FRA), “There will not be a silver bullet for solving this problem. This situation calls for an all-of-the-above approach – one that addresses the product itself, the tank car it is being carried in, and the way the train is being operated.” All of these potential risk-reducing solutions are addressed by the final rule released by the FRA on May 1, 2015. (On the same day, the Canadian Ministry of Transport released similar rules.) In order to view how the various requirements covered by the rule impact the risk to the public as a result of crude oil spills from railcars, we can diagram the cause-and-effect relationships that lead to the risk, and include the solutions directly over the cause they control. (To view the Cause Map, or visual root cause analysis, of crude oil train car derailments, click on “Download PDF”.)

The product: Bakken crude oil (as well as bitumen) can be more volatile than other types of crude oil and has been implicated in many of the recent oil fires and explosions. In addition to being more volatile, the composition (and thus volatility) can vary. If a material is not properly sampled and characterized, proper precautions may not be taken. The May 1 rule incorporates a more comprehensive sampling and testing program to ensure the properties of unrefined petroleum-based products are known and provided to the DOT upon request.   (Note that in the May 6, 2015 derailment and fire in Heimdahl, North Dakota, the oil had been treated to reduce its volatility, so this clearly isn’t an end-all answer.)

The tank car: Older tank cars (known as DOT-111s) were involved in the Lac-Mégantic and other 2013 crude oil fires. An upgrade to these cars, known as CPC-1232, hoped to reduce these accidents. However, CPC-1232 cars have been involved in all of the issues since 2013. According to Cynthia Quarterman, former director of the Pipeline and Hazardous Materials Safety Administration, says that the recent accidents involving the newer tank cars “confirm that the CPC-1232 just doesn’t cut it.”

The new FRA rule establishes requirements for any “high-hazard flammable train” (HHFT) transported over the US rail network. A HHFT is a train comprised of 20 or more loaded tank cars of a Class 3 flammable liquid (which includes crude oil and ethanol) in a continuous block or 35 or more loaded tank cars of a Class 3 flammable liquid across the entire train. Tank cars used in HHFTs constructed after October 1, 2015 are required to meet DOT-117 design criteria, and existing cars must be retrofitted based on a risk-based schedule.

The way the train is being operated: The way the train is being operated includes not only the mechanics of operating the train, but also the route the train takes and the notifications required along the way. Because the risk for injuries and fatalities increases as the population density increases, the rule includes requirements to perform an analysis to determine the best route for a train. Notification of affected jurisdictions is also required.

Trains carrying crude oil tend to be very large (sometimes exceeding one mile in length). This can impact stopping distance as well as increase the risk of derailment if sudden stopping is required. To reduce these risks, HHFTs are restricted to 50 mph in all areas, and 40 mph in certain circumstances based on risk (one of the criteria is urban vs. rural areas). HHFTs are also required to have in place a functioning two-way end of train or distributed power braking system. Advanced braking systems are required for trains including 70 or more loaded tank cars containing Class 3 flammable liquids and traveling at speeds greater than 30 mph, though this requirement will be phased in over decades.

It is important to note that this new rule does not address inspections of rails and tank cars. According to a study of derailments from 2001 to 2010, track problems were the most important causes of derailments (with broken rails or track welds accounting for 23% of total cars derailed). A final rule issued January 24, 2014 required railroads to achieve a specified track failure rate and to prioritize remedial action.

To view the May 1 rule regarding updates to crude-by-rail requirements, click here. To view the timeline of incidents and the Cause Map showing the cause-and-effect relationships leading to these incidents, click “Download PDF”.

ISS Supply Mission Fails

By Kim Smiley

An unmanned Progress supply capsule failed to reach the International Space Station (ISS) and is expected to burn up during reentry in the atmosphere along with 3 tons of cargo.  Extra supplies are stored on the ISS and the astronauts onboard are in no immediate danger, but the failure of this supply mission is another in a string of high-profile issues with space technology.

This issue can be analyzed by building a Cause Map, a visual format of root cause analysis.  A Cause Map intuitively lays out the causes that contributed to an issue to show the cause-and-effect relationships.  To build a Cause Map, “why” questions are asked and the answers are documented on the Cause Map along with any relevant evidence to support the cause.

So why did the supply mission fail? The mission failed because the supply capsule was unable to dock with the ISS because mission control was unable to communicate with the spacecraft.  The Progress is an unmanned Russian expendable cargo  capsule that cannot safely dock with a space station without communication with mission control.  Mission control needs to be able to verify that all systems are functional after launch and needs a communication link to navigate the unmanned capsule through docking.

Images of the capsule showed that two of the five antennas failed to unfold leading to the communication issues.  Debris spotted around the capsule while it was in orbit indicates a possible explosion.  No further information has been released about what might have caused the explosion and it may be difficult to decisively determine the cause since the capsule will be destroyed in orbit.

The ISS recycles oxygen and water to an impressive degree and food is the first supply that would run out on the ISS, but NASA has stated that there are at least four months of food onboard at this time.  The failure of this mission may mean that the cargo for future missions will need to be altered to include more basic necessities and less scientific equipment, but astronaut safety is not a concern at this time. The failure of this mission does put additional pressure on the next resupply mission scheduled to be done by SpaceX in June in addition to creating more bad press for space programs that are already struggling during a turbulent time.

To view a intermediate Cause Map of this issue, click on “Download PDF” above.

Earthquake Hits Nepal

By Kim Smiley

As anyone paying any attention to the news knows, a magnitude 7.8 earthquake hit Nepal on April 25, 2015.   The same forces that created the Himalayan Mountains are still at work in the region as the Indo-Australian Plate slowly slides under the Eurasian Plate and experts have long warned about the potential for an earthquake in this location.

At least 4,600 people were killed as a result of the earthquake and the United Nations has stated that 8 million people have been affected.  Many people impacted by the disaster lack adequate water and food and are living in temporary shelters without sanitation facilities.  Beyond the sheer scope of the natural disaster, providing emergency assistance has also been difficult because some of the affected villages are in remote locations that are challenging to access and many roads were damaged by the earthquake.  The long-term economic impacts are also predicted to be large because of the significant damage to infrastructure and the fact that local economies relay heavily on tourism.

A Cause Map, a visual root cause analysis, can be built to help understand this disaster better. A Cause Map lays out the cause-and-effect relationships in an intuitive format by asking “why” questions.  In this tragic example, asking why so many fatalities occurred shows that the majority of deaths were caused by collapsing buildings.  Many buildings in the impacted area were unreinforced masonry structures that couldn’t withstand the force of the earthquake.  These buildings are cheaper and quicker to build than more modern construction that would meet building codes designed to survive an earthquake.

Civil unrest in the region has resulted in rapid urbanization and a large demand for housing as people moved into cities. Rapid and relatively unregulated urbanization in a country with one of the lowest per capita incomes in the world proved to be a deadly combination in a region prone to earthquakes. Historically a major earthquake has struck this region about every 75 years and this one had long been predicted.  Says Susan Hough, a geologist with the U.S. Geological Survey, “It was clearly a disaster in the making that was getting worse faster than anyone was able to make it better. You’re up against a Himalayan-scale problem with Third World resources.”

Every disaster and the emergency response to it should be studied to see if there are any lessons learned that can be used to save lives and minimize damage in the future. There is clearly no “solution” that can prevent an earthquake, but even when dealing with a natural disaster there are ways the impact of a disaster could be mitigated.  The possible solutions may not be cheap or easy, but it is important to remember that it is possible. You can’t stop the earthquake, but you can work to build stronger buildings.

Concrete slab smashes truck killing 3

By Kim Smiley

On April 13, 2015, a large section of a concrete barrier fell from an overpass onto a truck in Bonney Lake, Washington. A couple and their baby were in the vehicle and were all killed instantly. Investigators are working to determine what caused this accident and to determine why the road under the overpass remained open to traffic while construction was being done on the overpass.

A Cause Map, a visual method of root causes analysis, can be built to help understand this accident. More information is still needed to understand the details of the accident, but an initial Cause Map can be created now to capture what is known and it can be easily expanded to include additional information as it becomes available. A Cause Map is created by asking “why” questions and visually laying out the answers to show the cause-and-effect relationships. (Click here to learn more about basics of Cause Mapping.)

In this accident, three people were killed because the vehicle they were riding in was smashed by a large slab of concrete. The vehicle was hit by the concrete slab because it was accidently dropped and the truck was under the overpass at the time it fell because the road was open to traffic. (When two causes are both needed to produce and effect, the causes are listed on vertically on the Cause Map and separated by and “and”.) The road would typically have been closed to traffic while heavy work was performed on the overpass, but the work plan for the construction project did not indicate that any heavy work would be performed on the day of the accident.   At some point the actual work schedule must have deviated from the planned schedule, but no change was made in plan for managing traffic resulting in traffic traveling under the overpass while potentially dangerous construction was performed.

Investigators are still working to understand exactly why the concrete slab fell, but early indication is that temporary metal bracing that was supporting the concrete may have failed due to buckling. The concrete barrier on the overpass were being cut into pieces at the time of the accident so that they could be removed as part of a $1.7 million construction project to improve pedestrian access which included adding sidewalks and lights.

Once the details of what causes this tragic accident are better understood, solutions can be developed and implemented that will help reduce the risk of something like this happening again. To view a high level Cause Map of this accident, click on “Download PDF” above.

You can also read a previous blog “Girder Fell on Car, Killing 3” to learn more about a similar accident that occurred in 2004.