Category Archives: Root Cause Analysis – Incident Investigation

Facebook Bug Makes Users Feel Old

By ThinkReliability Staff

In a real blow for an industry constantly trying to remain hip and relevant, many Facebook users were notified of “46 year anniversaries” of their relationships with friends on Facebook on the last day of 2015. Facebook (which is itself only 11 years old) issued a statement saying “We’ve identified this bug and the team’s fixing it now so everyone can ring in 2016 feeling young again.”

While Facebook didn’t release any details about what caused the bug, a pretty convincing explanation was posted by Microsoft engineer Mark Davis. We can his theory to create an initial Cause Map, or visual root cause analysis. The first step in the Cause Mapping process is to fill out a problem outline. The problem outline captures the what (Facebook glitch), when (December 31, 2015), where (Facebook) and the impact to the organization’s goals. In this case, the only goals that appear to be impacted are the customer service goal (resulting from the negative publicity to Facebook) and the labor/time goal (which resulted from the time required to fix the glitch).

The next step in the Cause Mapping process is the analysis. The Cause Map begins with an impacted goal. Asking “Why” questions develops the cause-and-effect relationship that resulted in the effect. In this case, the impact to the customer service goal results from the negative publicity. Continuing to ask “Why” questions will add more detail to the Cause Map. The negative publicity was caused by Facebook posting incorrect anniversaries.

Some effects will result from more than one cause. Facebook posting incorrect anniversaries can be considered an effect that was caused by incorrect anniversary dates being identified by Facebook AND Facebook posting anniversary dates. Because both of these causes were required to produce an effect, they are joined with an “AND” on the Cause Map. (If the anniversary dates had been identified correctly, or if they weren’t posted on Facebook, the issue would not have occurred.) The incorrect anniversary dates were due to a software glitch (or bug), according to Facebook. Inadequate testing can generally be considered a cause whenever any bug is found in software that is used or released to the public. Had a larger range of dates been used to test this feature, the software glitch would have been identified before it resulted in public postings on Facebook.

Other impacted goals are added to the Cause Map as effects of the appropriate goals. In this case, the labor/ time goal is impacted because of the time needed to fix the glitch. The cause of this is the software glitch. All impacted goals should be added to the Cause Map.

The cause of the software bug is not definitively known. To indicate potential causes, we include a “?” after the cause, and include as much evidence as possible to support the cause. Testimony can be used as evidence for causes. In this case, the source of the potential causes is a Microsoft engineer, who described a potential scenario that could lead to this issue on Facebook. Unix, which is an operating system, associates the value of “0” with the date of 1/1/1970 (known as the Unix epoch). If the date a user friended another user was entered as “0” and the system identified friending dates for all friends, the system would identify friending dates as 1/1/970, and with some accounting for time zones, would see 46 years of friendship on December 31, 2015. It is presumed that the friend date would be entered as “0” if a friendship already existed prior to Facebook tracking anniversaries.

Errors associated with the Unix epoch are pretty common, but this appears to be the first time a bug like this has bitten Facebook. Presumably the error was quickly fixed, but we won’t know for sure until next December.

Celebrating with a bit of bubbly? Read this first . . .

By ThinkReliability Staff

What better day than New Year’s Eve to pop open a bottle of champagne (or its non-French sibling, sparkling wine)? Great thought, but turns out there’s a right way to open a bottle of bubbly, and “pop” has nothing to do with it.

Your initial thought may be who cares? What possible difference could it make how I open a bottle? Well, assuming your goal is to celebrate an enjoyable evening with friends, family, or maybe a date, using an improper opening procedure could impact the safety goal, by injuring yourself or others. It can also affect your reputation by failing to impress those with whom you’ve chosen to celebrate (as well as anyone else in the vicinity). The lost champagne is an impact to the property goal, and the potential for clean-up impacts the labor goal (and is clearly not what you want to be spending your New Year’s Eve doing).

A study claims that 900,000 injuries per year result from champagne. Injuries typically result from corks hitting faces, especially eyes. The pressure inside a bottle of champagne can be as high as 90 pounds per square inch, resulting in a cork traveling at speeds of up to 50 miles an hour. Injuries resulting from slips on spilled champagne also fall into this category.

Both spills and flying corks can be prevented by using a proper procedure to open a bottle of champagne. The preparation starts far before the party does. The first step is to ensure that the champagne is cooled properly. This is not only for taste, but also for safety. Another study found that cooling the bottle to 39 degrees F (4 degrees C) reduces the speed at which the cork leaves the bottle. (The cork travels only 3/4 of the speed of that from a room temperature, or 64 degrees F, bottle.)

Once you’re ready to serve the champagne, grab the bottle, glasses, and a kitchen towel. Check to see if there’s a tab on the foil covering the neck. If not, you’ll also need a knife. (One thing you won’t need? A corkscrew.) Remove the foil from the neck, by pulling the tab if one is present or by cutting with a knife, and then peeling it off. From this point until you start pouring, keep the bottle pointed at a 45 degree angle, and away from people, breakable objects, walls and ceilings. Untwist the wire tab, or key, and remove the wire cage, and hold your thumb over the cork. Cover the cork and neck of the bottle with the kitchen towel, and grab both the towel and cork with one hand. With the other hand, gently and slowly twist the bottle until the cork slides out. (This will be not with a pop, but more of a whimper.) Do not shake the bottle!

Hold champagne flutes at an angle and pour champagne in on the side to preserve the bubbles. Repeat as necessary. If you’ll need to leave the location at which you are drinking, please do it as a passenger, or wait until you’ve sobered up. For an average person, that means waiting about an hour for every 5 ounces of wine/ champagne consumed. (The drink size of other kinds of alcohol is defined differently, and your weight will impact the time it takes for alcohol to leave your system.)

If you or someone else forgets these rules and ends up getting hit in or near the eye with a champagne cork, take a trip to the ophthalmologist right away. (Because it’s New Year’s Eve, you may have to hit the emergency room first.) Says ophthalmologist Andrew Iwach, MD, “The good news is that as long as we can see these patients in a timely fashion, then there’s so many things we can do to help these patients preserve their vision.”

To view a visual diagram of the proper champagne-opening procedure, click on “Download PDF” above.

The year Christmas almost wasn’t

By Kim Smiley

The movie Elf, starring Will Ferrell as Buddy the elf, tells the story of a Christmas that nearly disappointed children worldwide.  On Christmas Eve night, as Santa made his magical trip to deliver his bag of Christmas gifts, his sleigh crashed in Central Park in New York City.  Only quick thinking by Buddy and his friends got Santa airborne again and saved the holiday.

A Cause Map, a visual root cause analysis, can be built to analyze the crash of Santa’s sleigh.  A Cause Map is built by visually laying out all the cause-and-effect relationships that contributed to the issue.  The first step in the Cause Mapping process is to fill in an outline with the basic background information as well as impacts to the goal.  Nearly every problem impacts more than one goal and listing all the impacts helps fully understand the scope of the issue.

In this example, there is potential risk of damage to the sleigh and injury to the big guy himself which would be an impact to the equipment goal and safety goal respectively.  There was a delay in the present delivery schedule while Santa’s sleigh was on the ground, but the biggest concern was the impact to the customer service goal because millions of children had the potential to wake up to a Christmas morning without gifts, certainly something Santa and his elves desperately wanted to avoid.   Once the Outline is completed, the Cause Map itself is built by starting at one impacted goal and asking “why” questions.

So why did Santa’s sleigh crash into Central Park?  Santa’s sleigh crashed because it was high above the ground and it lost propulsion.  Flying is the sleigh’s typical mode of operation because Santa needs a speedy, magical mode of transportation to do his job.  The sleigh lost propulsion because both the primary and secondary propulsion systems failed.

Originally, Santa’s sleigh was powered purely by Christmas cheer, but levels of Christmas cheer have been steadily declining in modern times and a secondary system, a Kringle 3000, 500 Reindeer-Power jet engine, had to be added in the 1960s to keep the sleigh flying.  On the Christmas in question, the level of Christmas cheer hit an all-time low and the strain on the jet engine mount was too great and it broke off.  Without the jet engine, Santa’s sleigh crashed. Luckily, Buddy had told his friends that “the best way to spread Christmas cheer is singing loud for all to hear” and they were able to inspire enough folks to sing along with carols that Santa’s sleigh flew back into action and the children got their presents.

One would hope that the design of the jet engine was improved after this accident, but just to be safe and ensure that there are no sleigh crashes this year, make sure you sing plenty of Christmas carols loudly for all your friends and families to hear!  And if you are concerned about Santa’s progress and want assurances that all is well, you can monitor his progress around the world at the NORAD Santa tracker.

Newly Commissioned USS Milwaukee Breaks Down at Sea

By ThinkReliability Staff

On December 11, 2015, just 20 days after commissioning, the USS Milwaukee completely lost propulsion and had to be towed back to port. This obviously brought up major concerns about the reliability of the ship. Said Senator John McCain (R-Arizona), head of Senate’s Armed Services Committee, “Reporting of a complete loss of propulsion on USS Milwaukee (LCS 5) is deeply alarming, particularly given this ship was commissioned just 20 days ago. U.S. Navy ships are built with redundant systems to enable continued operation in the event of an engineering casualty, which makes this incident very concerning. I expect the Navy to conduct a thorough investigation into the root causes of this failure, hold individuals accountable as appropriate, and keep the Senate Armed Services Committee informed.”

While very little data has been released, we can begin an investigation with the information that is known. The first step of a problem investigation is to define the problem. The “what, when and where” are captured in a problem outline, along with the impacts to the organization’s goals. In this case, the mission goal is impacted due to the complete loss of propulsion of the ship. The schedule/production goal is impacted by the time the ship will spend in the shipyard receiving repairs. (The magnitude and cost of the repairs has not yet been determined.) The property/equipment goal is impacted because metal filings were found throughout both the port and starboard engine systems. Lastly, the labor and time goal is impacted by the need for an investigation and repairs.

The next step of a problem investigation is the analysis. We will perform a visual root cause analysis, or Cause Map. The Cause Map begins with an impacted goal and asking “why” questions to diagram the cause-and-effect relationships that led to the incident. In this case the complete loss of propulsion was caused by the loss of use of the port shaft AND the loss of use of the starboard shaft. The ship has two separate propulsion systems, so in order for the ship to completely lose propulsion, the use of both shafts had to be lost. Because both causes were required, they are joined with an “AND”.

We continue the analysis by continuing to ask “why” questions of each branch. The loss of use of the port shaft occurred when it was locked as a precaution because of an alarm (the exact nature of the alarm was not released). Metal filings were found in the lube oil filter by engineers, though the cause is not known. We will end this line of questioning with a “?” for now, but determining how the metal filings got into the propulsion system will be a primary focus of the investigation. The loss of use of the starboard shaft occurred due to lost lube oil pressure in the combining gear. Metal filings were also found in the starboard lube oil filter. Again, it’s not clear how they got there, but it will be important to determine how the lube oil system of a basically brand new ship was able to obtain a level of contamination that necessitated full system shutdown.

While metal filings in the lube oil system is not a class-wide issue, it’s not the first time this class of ship has had problems. The USS Independence and USS Freedom, the first two ships of the class, suffered galvanic corrosion which caused a crack in the Freedom’s hull. The Freedom also suffered issues with its ship service diesel engines, a corroded cable, and a faulty air compressor.

Once all the causes of the breakdown are determined, engineers will have to determine solutions that will allow the ship to return to full capacity. Additionally, because of the number of problems with the class, the investigation will need to take a good look at the class design and manufacturing practices to see if there are issues that could impact the rest of the class going forward.

To view a one-page downloadable PDF with the beginning investigation, including the problem outline, analysis, and timeline, click “Download PDF” above.

Component Failure & Crew Response, Not Weather, Brought Down AirAsia Flight QZ8501

By Staff

Immediately following the December 28, 2014 crash of AirAsia flight QZ8501, severe weather in the area was believed to have been the cause of the loss of control of the plane. (See our previous blog on the crash.) However, recovery of the “black box” and a subsequent investigation determined that it was a component failure and the crew’s response to the upset condition that resulted in the crash and that weather was not responsible. This is an example of the importance of gathering evidence to support conclusions within an investigation.

Says Richard Quest, CNN’s aviation correspondent, “It’s a series of technical failures, but it’s the pilot response that leads to the plane crashing.” Because, as in common in these investigations, there is a combination of causes that resulted in the crash, it can help to lay out the cause-and-effect relationships. We will do this in a Cause Map, a visual form of root cause analysis. The Cause Map is built by beginning with an impact to the goals, such as the safety goal, and asking why questions.

The 162 deaths (all on board) resulted from the plane’s rapid (20,000 feet per minute) plunge into the sea. According to the investigation, the crash resulted from an upset/ stall condition AND the crew’s inability to recover from that condition. Because both of these causes contributed to the crash, they are both connected to the effect (crash) and separated with an “AND”.

More detail can be added to each “leg” of the Cause Map by continuing to ask “why” questions. The prolonged stall/ upset condition resulted from the aircraft being pushed beyond its limits. (It climbed 5,400 feet in about 30 seconds.) This occurred because of manual handling and because of the failure of the rudder travel limiter system, which is designed to restrict rudder movement to a safe range. The system failed due to a loss of electrical continuity from a cracked solder joint on a circuit board. Although maintenance records showed 23 complaints with the system in the year prior to the crash, it was not repaired. A former pilot and member of the investigation team stated it was considered “minor damage” and was “not a concern”.

The plane was being manually controlled because the autopilot and autothrust were disengaged. These systems were disengaged when a circuit breaker was reset (removed and replaced) to attempt to reset the system after a computer system failure (indicated by four alarms that sounded in the cockpit). While this is sometimes done on the ground, it shouldn’t be done in the air because it disengages the autopilot and autothrust systems. However, the crew had inadequate upset recovery training. According to the manual from the manufacturer the aircraft is designed to prevent it from becoming upset and therefore training is not necessary. The decision to manually place the plane in a steep climb is believed to have been an attempt to get out of the poor weather. Just prior to the crash, the less experienced co-pilot was at the controls.

The lack of crew training on upset conditions is also believed to have caused the crash. In addition, for at least some time prior to the crash, the pilot and co-pilot were working against each other by pushing their control sticks in opposite directions. The pilot was heard on the voice recorder calling for them to “pull down”, although “pulling” is used to bring the plane up.

The only recommendation that has so far been released is for commercial pilots to undergo flight simulator training for this type of emergency situation. AirAsia has already done so. The company, as well as the aviation industry as a whole, will hopefully look at the conclusions of the investigation report with a very critical eye towards improving safety.

Why New Homes Burn Faster

By Kim Smiley

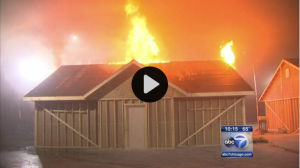
Screen Shot 2015-12-04 at 11.50.42 AMResearch has shown that new homes burn up to eight times faster than older homes.  What this means is that people have less time to get out of a house when a fire starts – a lot less time.  People living in older homes with traditional furnishings were estimated to have about 17 minutes to safely evacuate a home, but the time decreases to about three minutes in a home built with modern materials and furnished with newer, synthetic furniture.

Modern manufactured wood building materials have a lot of advantages. They are lighter, stronger and cheaper than using traditional wood materials, but these characteristics also mean they burn a lot faster.  Additionally, modern homes typically contain more potential fuel for fires. Many modern furnishings are manufactured using synthetics that contain hydrocarbons, which are a flammable petroleum product.  Furnishings manufactured with synthetic products will burn faster and hotter than traditional furnishings built using wood, cotton and down.  Most modern homes also just simply have more stuff in them that is potential fuel.

Other factors can also make modern homes more dangerous when a fire occurs. Many modern homes are open concept designs as opposed to more compartmentalized traditional designs.  Open spaces in a home can provide more oxygen for a fire to quickly grow.  Additionally, modern energy-efficient windows can help trap heat in a home when a fire starts and can lead to a fire spreading more rapidly. Changes in the way we live and build homes and furnishings have all contributed to modern homes building significantly faster, a potential danger that people need to be aware of so that they can work to keep themselves and their children safe.

The best way to protect yourself and your family is to prevent a fire from occurring in the first place.  Never leave candles burning unattended. Keep all potentially flammable items away from fireplaces and heaters. Don’t leave things on the stove unattended. During the holidays, make sure to keep Christmas trees well watered and away from heat sources and ensure candles are a safe distance from any potentially flammable objects.   These and other basic common sense steps really do prevent fires from occurring.

Of course there is no way to guarantee that a fire will never occur so every house needs working smoke detectors.  It is recommended that they are checked monthly to verify they are functional and that the batteries are changed regularly.  Most fatalities associated with home fires are in homes without working smoke detectors so it really is worth the time and effort to ensure they are kept in good working order.

To view a Cause Map, a visual root cause analysis of this issue, click on “Download PDF” above.


Neurotoxin makes California crabs unsafe to eat

By Kim Smiley

California officials have delayed indefinitely both recreational and commercial fishing for Dungeness and Rock crab from the coast north of Santa Barbara all the way to the Oregon border because the crabs have been determined to be a threat to public safety.  Testing has shown that many of the crabs in this region contain potentially unsafe levels of domoic acid, a powerful neurotoxin, that can cause illness in humans if they consume the crabs. Domoic acid poisoning causes vomiting, diarrhea, cramping and can even lead to brain damage and death in severe cases.  Scientists are continuing to test crabs caught off the California coast and the hope is to open crabbing season if/when the crabs are found to be safe for consumption.

A Cause Map, a visual root cause analysis, can be built to help understand the causes that contribute to this issue.  The first step in building a Cause Map is to understand the impacts from the issue being considered.  Obviously this issue has the potential to impact public safety because the crabs have the potential to cause illness, although no cases of domoic acid poisoning in humans have been reported in this year. The economic impact to the fishing industry from the delay in the start of crabbing season is also very significant.  California’s crabbers typically gross about $60 million a year and many families depend on the money made during crab season to live on throughout the year.  This issue also impacts the environment because humans aren’t the only animals that can suffer from domoic acid poisoning and other creatures are continuing to eat the contaminated crabs.  Sea lions in particular have been affected by the neurotoxin and many have died.  Removing large predators has the potential to significantly impact the entire ecosystem.

The Cause Map itself is built by asking “why” questions and laying out the answers to intuitively show the cause-and-effect relationships. So why do the crabs have high levels of domoic acid in their bodies?  This year off the coast of California, warmer than typical ocean temperatures have led to an unusually large and long-lasting algae bloom created by Pseudo-nitzschia. Domoic acid is naturally produced by Pseudo-nitzschia and it can be concentrated into dangerous levels as it moves up the food chain.  Small fish and shellfish such as krill, anchovies and sardines consume the domoic acid along with the algae.  Crabs eat the smaller creatures that have been contaminated with domoic acid.  Crabs can eventually excrete the domoic acid, but the process is slow and takes enough time that the domoic acid can build up to high levels in the bodies of the crabs.  If bigger creatures such as humans and sea lions eat the contaminated crabs, they can be poisoned by the domoic acid that was initially produced by the algal bloom.  There is nothing that can make the contaminated crabs safe for consumption. Neither cooking nor cleaning can eliminate the risk of poisoning from the neurotoxin so the only safe option is to wait until the domoic acid returns to safe levels in the crabs.

To view an Outline that lists the impacted goals and see a high level Cause Map of this issue, click on “Download PDF” above.

High School Open Flame Chemistry Demonstration Ends in Injuries

By Kim Smiley

Six were injured, two seriously, in an accident involving an open flame chemistry demonstration at a high school in Fairfax County, Virginia on October 31, 2015.  At the time of the incident, the teacher was performing a well-known experiment to show the students how different chemical elements can change the color of a flame. According to students present in the classroom, the teacher was in the process of adding more flammable liquid to the experiment when a splash of fire hit students and the teacher.

A Cause Map, or visual root cause analysis, can be used to analyze this incident.  The first step in the Cause Mapping process is to fill in an outline to document all the basic background information for an incident such as time, date, and location.  Additionally, how the incident impacts the organization’s goals is listed on the bottom of the outline.  For this example, the safety goal is clearly impacted by the injuries, but there are several other impacts that need to be considered as well such as the damage to the classroom, evacuation of the school and required emergency response.  Fairfax County has also banned all open flame experiments pending a thorough investigation of this issue which can be considered an impact to the regulatory goal.

Once the Outline is complete, the Cause Map itself is built by asking “why” questions beginning with one of the impacted goals. Starting at the safety goal in this example, the first step would be to ask “why” were 6 people injured?  These injuries occurred because people were burned because there was an uncontrolled fire in a classroom, people were near the fire and no protective gear was worn.  (When there is more than one cause that contributes to an effect, the cause boxes are listed vertically and separated by “and” to show that all causes were required.)  No information has been released to the public about why the students were sitting so near the open flame experiment without any type of safety barrier or why protective gear wasn’t worn, but these are both branches of the Cause Map that should be expanded during a complete investigation.  If the same fire had occurred, injuries may have been prevented or at least been less severe if the students were farther away from the flames or if they had protective gear on to protect them from burns.  It’s important to understand why the experiment was performed as it was in order to develop solutions that could prevent injuries in the future.

There has been a little information released about why the fire was uncontrolled during the experiment.  Eyewitnesses have stated that the teacher was adding more fuel to the fire because it was starting to burn out.  As liquid fuel was added, the fire spread unexpectedly and burning fuel splashed out of the experiment location onto students and the teacher performing the experiment.  The specific details of what occurred during this specific fire have not been released and should be looked at during the detailed investigation.  Once more information is known, the Cause Map could be easily expanded to incorporate it.

The Chemical Safety Board (CSB) is not investigating this incident, but has stated that it is gathering information on it.  The recent accident appears to be similar to three accidents involving open flame experiments that injured children during an 8 week period in 2014.  These three accidents all involved experiments using flammable liquid, a flashback to the bulk containers of fuel and fire engulfing members of the audience.  Following the 2014 accidents, the CSB issued a safety bulletin titled “Key Lessons for Preventing Incidents from Flammable Chemicals in Educational Demonstrations”.   Key lessons listed from the CSB safety bulletin that should be considered when planning open flame experiments are as follows:

– Do not use bulk containers of flammable chemicals in educational demonstrations when small quantities are sufficient.

– Implement strict safety controls when demonstrations necessitate handling hazardous chemicals – including written procedures, effective training, and the required use of appropriate personal protective equipment for all participants.

– Conduct a comprehensive hazard review prior to performing any educational demonstration.

– Provide a safety barrier between the demonstration and audience.

Are Your Vehicle’s Tires Safe?

By ThinkReliability Staff

Four vehicle accidents between February and May of 2014 took 12 lives and injured 42 more. While the specifics of the accidents varied, all four were due to tread separations on tires. Later that year the National Transportation Safety Board (NTSB) hosted a Passenger Vehicle Tire Safety Symposium to address areas of concern regarding passenger vehicle safety due to tire issues. A special investigation report, which was adopted October 27, 2015, provides a summary of the issues and industry-wide recommendations to improve passenger vehicle safety.

There are multiple issues causing safety concerns with tires, and multiple recommendations to mitigate these safety risks. When dealing with a complex issue such as this, it can help to visually diagram the cause-and-effect relationships. We can do this in a Cause Map, or visual root cause analysis. This analysis begins with an impact to the organization’s goals. According to the NTSB report, tire-related accidents cause more than 500 deaths and 19,000 injuries every year in the US. Customer service (customers being members of the public who purchase and/or use tires) is impacted due to a lack of understanding of tire safety. The regulatory goal is impacted due to a lack of tire registration, and the production goal is impacted due to a low recall completion rate. Lastly, the property goal is impacted due to tires that are improperly maintained.

Cause-and-effect relationships are developed by beginning with an impacted goal (in this case, the deaths and injuries) and asking “why” questions. In this case, the deaths and injuries are due to tire-related accidents, of which there are about 33,000 every year in the US. Tire-related accidents includes accidents that are due to tire issues (such as tread separation) caused by improper maintenance or an unrepaired manufacturing issue with a tire (specifically those resulting in a tire recall). While the NTSB is recommending the promotion of technology that may reduce the risk of tire-related accidents, they also made recommendations that can reduce the risk of these accidents in the near term.

From 2009-2013, there were 3.2 million tires recalled in 55 safety campaigns. However, 56% of recalled tires remain in use, because of very low recall work completion rates. In a typical tire recall, only about 20% of recalled tires are returned to the manufacturer. (In comparison, about 78% of recalled cars are repaired.)   Many tires aren’t registered, and if they aren’t, it’s difficult to reach owners when there are recalls. Independent dealers and distributors, which sell 92% of tires in the US, aren’t required to register tires. While it is possible for consumers to look up their own tires to determine if they’ve been recalled, it’s difficult. The full tire identification number may not be printed in an accessible location, and the National Highway Traffic Safety Administration (NHTSA) website for tire recalls was found to be confusing.

The NTSB has recommended that tire manufacturers include the full tire identification number on both the inboard and outboard side walls of each tire so it can be more easily found by consumers. The NTSB has also recommended that the NHTSA, with the cooperation of the tire industry and Congress, if necessary, improve its recall site to allow search by identification number or brand and model, and improve registration requirements and the recall process.

Regarding improper maintenance, the report found that 23% of tire-related crashes involved tire aging and that 50% of drivers use the wrong tire inflation pressure, 69% have an underinflated tire, 63% don’t rotate their tires, and 12% have at least one bald tire. The report found that consumers have an Inadequate understanding of tire aging and service life and recommends developing test and best practices related to tire aging, and developing better guidance for consumers related to tire aging, maintenance and service life.

The NTSB has issued its own Safety Alert for Drivers, which includes the following guidance:

– Register new tires with the manufacturer

– Check your tire pressure at least once a month

– Inflate your tires to the pressures indicated in your vehicle owner’s manual (not on the tire sidewall)

– When checking tire pressure, look for signs of damage

– Keep your spare tire properly inflated and check it monthly for problems

– Rotate, balance and align your tires in accordance with your vehicle owner’s manual

– If you hear an unusual sound coming from a tire, slow down and have your tires checked immediately

To view the Cause Map, including impacted goals and recommendations, click on “Download PDF” above. Or, click here to read the NTSB’s executive summary.


Interim Recommendations After Fatal Chemical Release

By ThinkReliability Staff

After a fatal chemical release on November 15, 2014 (see our previous blog for an initial analysis), the Chemical Safety Board (CSB) immediately sent an investigative team. The team spent seven months on-site. Prior to the release of the final report, the CSB has approved and released interim recommendations that will be addressed by the site as part of its restart.

Additional detail related to the causes of the incident was also released. As more information is obtained, the root cause analysis can be updated. The Cause Map, or visual root cause analysis, begins with the impacts to the organization’s goals. While multiple goals were impacted, in this update we’ll focus on the safety goal, which was impacted due to four fatalities.

Four workers died due to chemical asphyxiation. This occurred when methyl mercaptan was released and concentrated within a building. Two workers were in the building and were unable to get out. One of these workers made a distress call, to which four other workers responded. Two of the responding workers were also killed. (Details on the attempted rescue process, including personal protective equipment used, have not yet been released.) Although multiple gas detectors alarmed in the days prior to the incident, the building was not evacuated. The investigation found that the alarms were set above permissible exposure limits and did not provide effective warning to workers.

Methyl mercaptan was used at the facility to manufacture pesticide. Prior to the incident, water accessed the piping system. In the cold weather, the water and methyl mercaptan formed a solid, blocking the pipes. Just prior to the release, the blockage had been cleared. However, different workers, who were unaware the blockage had been cleared, opened valves in the system as previously instructed to deal with a pressure problem. Investigators found that the pressure relief system did not vent to a “safe” location but rather into the enclosed building. The CSB has recommended performing a site-wide pressure relief study to ensure compliance with codes and standards.

The building, which contained the methyl mercaptan piping, was enclosed and inadequately ventilated. The building had two ventilation fans, which were not operating.   Even though these fans were designed PSM critical equipment (meaning their failure could result in high consequence event), an urgent work order written the month prior had not been fulfilled. Even with both fans operating, preliminary calculations performed as part of the investigation determined the ventilation would still not have been adequate. The CSB has recommended an evaluation of the building design and ventilation system.

Although the designs for processes involving methyl isocyanate were updated after the Bhopal incident, the processes involving methyl mercaptan were not. The investigation has found that there was a general issue with control of hazards, specifically because non-routine operations were not considered as part of hazard analyses. The CSB has recommended conducting and implementing a “comprehensive, inherently safer design review” as well as developing an expedited schedule for other “robust, more detailed” process hazard analyses (PHAs).

Other recommendations may follow in the CSB’s final report, but these interim recommendations are expected to be implemented prior to the site’s restart, in order to ensure that workers are protected from future similar events.

To view an updated Cause Map of the event, including the CSB’s interim recommendations, click “Download PDF” above. Click here to view information on the CSB’s ongoing investigation.