Tag Archives: root cause analysis

Lead Poisoning Threatens California Condor Population

By Kim Smiley

A recent study found that lead poisoning remains a significant hurdle to the recovery of the California condor population, one of the world’s most endangered species.  Scientists reviewed blood samples taken from wild California condors between 1997 and 2010 and found that many birds have dangerously high levels of lead in their bodies.  Nearly half of the birds had lead levels that were high enough that they could have died without treatment.

This issue can be analyzed by building a Cause Map, a visual root cause analysis. The first step in beginning a Cause Map is to determine the impact to the overall organization goals.  In this example, the environmental goal is impacted because an endangered species is threatened.  To continue building the Cause Map, “why” questions are asked and the answers are added to the Cause Map to show the cause-and-effect relationships between the things that contributed to the issue.  To view a high level Cause Map of this issue, click “Download PDF” above.

In the case of California condors, the species is threatened because the birds are ingesting lead and it’s dangerous.  Lead is dangerous because it is a poison that can cause illness or death.  The birds are ingesting lead because they eat a large number of animals and some of the animals contain lead.

There is lead in some of the animals because California condors will eat gut piles and carcasses left behind by hunters and these animals may contain fragments from lead bullets.  Additional causes are the fact that lead bullets are very common and that hunting is allowed in condor country.  This is caused in part because condors have large habitats because of their large range.  Condors are huge birds with wingspans of nearly 10 feet and they must travel long distances to find the large amount of food they require.

Determining the best way to prevent lead poisoning in condors is a difficult question for scientists.  Part of the problem is that a very small amount of lead can cause dangerous lead levels in a condor.  A single bullet fragment can be deadly. The short term solution is to treat the birds for lead poisoning by feeding them calcium-based drugs that bind with lead and remove it from the birds. One solution that has been tried is a California law banning lead bullets in the areas populated by condors, but the study found that it has had little impact in lead levels.  The issue of how to deal with the California condor lead poisoning issue without extensive ongoing human intervention and medical treatment remains open.

Pipeline Spill in Alberta Threatens Drinking Water

by ThinkReliability Staff

A pipeline spill in Alberta, Canada of up to 480,000 litres was noticed on the evening of June 7, 2012.  Although pipelines are estimated to spill approximately 3.4 million litres a year, they are not frequently near populated areas or water sources.  However, due to the proximity of this spill to a drinking water source, there was the potential of impact to drinking water.  An issue of this magnitude, with this type of impact, is thoroughly investigated to reduce the risk of recurrence.  We can examine this issue in a visual root cause analysis performed as a Cause Map.

We begin with the impacts to the goals.  In this case, the safety goal is impacted because of the potential impact to drinking water.  The environmental goal is impacted because of the spill of sour crude oil.  The spill is impacting area residents in a variety of ways, which can be considered an impact to the customer service goal.  The production goal was impacted due to a 10-day shutdown of a portion of the pipeline.  The property goal is impacted by the damage to the pipeline, and the labor goal is impacted by the response and cleanup required.

Once we have developed the impacts to the goals, we can ask “Why” questions to develop the cause-and-effect relationships that resulted in those impacts.  The potential impact to drinking water resulted from the proximity of the spill to a drinking water source, because the spill was in a populated area, and the oil spill itself.  The oil spill resulted from damage to the pipeline and the time elapsed before the spill was stopped.  Because the longer a spill goes undetected, the more environmental impact it has, consideration of the adequacy of monitoring, inspection and testing must be considered to ensure that this risk is reduced.

Although the cause of the pipeline damage is still being investigated, causes that have resulted in prior pipeline damage include construction damage, internal corrosion, and external corrosion.  External corrosion can result from exposure to water, which in this case was impacted by recent flooding of the river and shallow burying of the pipe, as was typical with earlier installations.  The age of the pipe may have also impacted the internal corrosion, as the more time that pipe is exposed to hydrocarbons (which the pipe transmits) the more corrosion will occur.

Immediate solutions include isolating the damaged area with a valve.  Then repairs were made to the pipeline, and cleanup began.  Cleanup is expected to take most of the summer.  There have been calls for increased monitoring, testing, and inspection of the line, and with an incident of this type, that frequency should be examined to ensure it is appropriate to minimize these types of risk.

To view the Outline, Cause Map, and Solutions, please click “Download PDF” above.

Deadly Kansas City Walkway Collapse

By Kim Smiley

On July 17, 1981, the second and fourth floor suspended walkways collapsed at the newly opened Hyatt Regency of Kansas City, Missouri.  A dance contest had attracted a crowd and the atrium under the walkway was filled with people.  This accident killed 113 people and injured 186.

The hotel was newly constructed and the walkways were well maintained.  So how did this happen?

A root cause analysis of this accident shows that there were a number of causes that contributed to the walkways collapsing.  Investigation into the accident shows that the structural design of the walkway was inadequate.  A weld failed which allowed a support rod to pull through the box beam and the walkways fell.

Additionally, the weld had greater stress than normal on it at the time of the failure because a large crowd had gathered to watch a danced content.  About 20 people were on second floor walkway and about 40 were on the fourth floor walkway at the time of the accident.  The higher loading combined to the walkway collapse.

Identifying the failure mechanism is important during an investigation, but a thorough root cause analysis needs to take the analysis farther to really understand the causes.  The reason that an inadequate design was built needs to be determined.

In this case, it appears that the design was changed without approval of the structural engineer.  This resulted from a communication error between the fabricator and the structural engineer.  The structural engineer sent a sketch of a proposed walkway design to the fabricator, assuming that the fabricator would work the details of the design himself. The fabricator assumed the sketch was a finalized drawing.   The fabricator then picked standard parts to fit the sketch.  This resulted in a significant change from the original design and dramatically decreased the load bearing capacity of the walkways.

The original design called for continuous hanger rods (a non-standard part that would have needed to be manufactured) that passed through the fourth floor walkway beam box to the second floor walkway, resulting in the ceiling connecting supporting the weight of both walkways.  The fabricator changed the design to use two shorter rods (standard parts) which resulted in the fourth floor walkway supporting the weight of the second floor walkway, which it wasn’t designed to handle.

It’s important to investigate beyond the point of inadequate design to learn what failed in the design process to prevent future accidents from occurring.

Deadly Plane Crash in Lagos, Nigeria

by ThinkReliability Staff

A devastating air crash in Lagos, Nigeria killed all on board and at least 10 on the ground.  This was the first major commercial air disaster since 2006.  Safety efforts since that disaster resulted in the US Federal Aviation Administration ( FAA) granting Nigerian    airlines its top air-safety rating.  Now concerns about air safety in Nigeria have resurfaced.  As a result of the crash, according to Harold Demuren, head of Nigerian civil aviation body: “We have suspended the entire Dana fleet.  They will be grounded as long as it takes to carry out the necessary investigations into whether they are airworthy.”

We can examine this incident in a Cause Map, or a visual root cause analysis.  We begin with the goals that were impacted.  In this case, the safety goal was impacted due to the deaths of people on the plane and on the ground.  We begin by asking “Why” questions to put together a very simple cause-and-effect relationship.  In this case, after losing both engines, Dana Air flight 992 crashed into a residential building in a highly populated suburb of Lagos, Nigeria, killing all 153 people on board and at least 10 on the ground.

The investigation of the plane crash is still ongoing.  However, it is known that both engines of the plane lost power, causing the plane to rapidly lose altitude and crash into a highly populated area.  Some of the areas being investigated that may have contributed to the crash are:

1) a bird strike (bird remains were found in one engine),

2) poor maintenance (although the plane was regularly inspected, there were also reports of leaking hydraulics and a history of poor airline safety in Nigeria, which appeared to have been remedied in recent years as indicated by the US FAA’s granting of its top air-safety rating,

3) overworked planes, likely due to financial considerations (the plane that crashed was on its fourth trip of the day), and/or

4) the age of the airplane (at 22 years old, it was technically not permitted to fly in Nigeria, which bans the use of planes over 20 years old).

As more information is revealed during the investigation it can be added to the Cause Map.  As the investigation is concluded, there will likely be more changes to Nigerian requirements and oversight for air safety.

To view the Outline and Cause Map, please click “Download PDF” above.

The Collapse of Agricultural Buildings

By ThinkReliability Staff

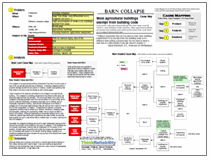
Every winter there are pockets of agricultural building collapses in areas that have seen heavy snow and ice accumulation.    The causes for these collapses can be examined in a Cause Map, or visual root cause analysis.  First, we begin by capturing the basic information about the issue.  In this case, there  were three areas that suffered building collapses due to winter weather accumulation.  This included New  York State in 1999,  Wisconsin in 2010, and England in 2010 and 2011.  Important to note is that each of these areas experienced heavy snowfall during the periods of collapse and in each region, agricultural buildings were more likely than other types of buildings to have collapsed.  It is also important to note that in each of these areas, agricultural buildings were not regulated to the same level as other buildings.

To begin our root cause analysis, we begin with the impacts to the goals. The collapse of an agricultural building carries with it the risk of human injury or loss of life, as well as potential loss of livestock.  A building collapse results in property damage as well as time spent on cleanup, repairs, and anything else that needs to be done to get the facility up and running again.

To continue the analysis, we begin with the impacted goals and ask “why” questions.  These impacts to the goals are all related to the collapse of an agricultural building.  The collapse of a building results when the stress (in this case, the structural load) exceeds the strength.  The structural loads in the case of the collapsed buildings generally result from accumulation of ice and snow, which  may be unevenly distributed, increasing local load, due to drifting, and an improperly engineered building.  Agricultural buildings are more likely to collapse due to structural loads because they are exempt from codes in most of the US and unregulated in England.  If engineering is desired, a properly engineered building may be scaled up or altered, resulting in changing loads and strengths, meaning the engineering review may no longer be valid to protect the building.  Although engineering is frequently skipped due to cost measures, experts say that proper engineering can save money by ensuring that supports are put in only where they’re needed (and, of course, reducing the risk of a collapse.)

Generally the collapsed buildings are found to have inadequate bracing, which reduces the strength of the building to the point of collapse.  If the buildings are not properly engineered, bracing may be inadequate for the design of the building.  Another issue  frequently seen is that the trusses are engineered, but are not reviewed with respect to the overall building design, leading to an insufficient analysis that does not take into account all of the factors that impact building loads and strength.

Although states and countries could elect to consider agricultural buildings in their codes, farmers don’t need to wait.  If you are building an agricultural building (or any building that may be exempt from code), ensure it’s adequately structurally engineered.  It may save a life.

To view the Outline and Cause Map, please click “Download PDF” above.  Or read more:

1999 collapses in NY State

2010 collapses in Wisconsin

2010 & 2011 collapses in England

$3 Bolt Causes $2.2 million in Damages to US Submarine

By ThinkReliability Staff

A $3 bolt was left in the main reduction gear of the USS Georgia after a routine inspection.  The extensive damage caused by the bolt resulted in 3 months in the shipyard for the submarine, causing it to miss deployment.  The propulsion shaft was left to operate for two days after sounds indicated that there was something wrong.  This may have increased the damage to the main reduction gear – damage which cost $2.2 million.

How did the bolt end up in the main reduction gear? Why was the propulsion shaft operated for 2 days after damage was suspected?

We can look at the causes that led to this incident in a Cause Map, a visual root cause analysis that clearly outlines cause-and-effect relationships that result in impacts to an organization’s goal.  The first step to building a Cause Map is to determine how the issue impacts the organization’s overall goals.  Here we can consider the US Navy as the organization.  The customer service goal (with the rest of the country as the “customers”) was impacted because the submarine was unavailable for deployment.  The production/schedule goal was impacted because the submarine was in the shipyard for  three months.  The damage to the main reduction gear is an impact to the property goal, and the repairs are an impact to the labor/time goal.  The total cost resulting from this issue was estimated to be $2.2 million.  Once the impacts to the goals have been determined, we can ask why questions to put together the cause-and-effect relationships that led to these impacts.

The bolt was left behind after a routine, annual inspection.  Because of the great potential for damage when foreign objects remain within equipment, detailed procedures are used for these inspections and include a log of all equipment brought into the area and a protective tent to keep objects from falling in.  Details of what went wrong that resulted in the bolt falling into the main reduction gear were not released, but the inspection was reported to have “inadequate prep and oversight” which likely contributed to the issue.

After the propulsion shaft was turned back on, noise indicated that there was a problem.  However, the shaft was operated for two days in a failed attempt at troubleshooting.  It’s likely that this increased the damage to the main reduction gear.  It is unknown what procedures were – or should have been – in place for troubleshooting, but the actions taken as a result of this incident suggest that proper procedures were not followed once the damage was suspected.

In this case, members of the crew who were found to not have performed their job – possibly by not following proper procedure – were punished in varying ways.  It is likely that the investigation went into great detail about whether procedures were adequate, what steps were not followed, and why, and the results also used to improve procedures for the next inspection.

To view the Outline and Cause Map, please click “Download PDF” above.

Fire kills 146, Leads to Improved Working Conditions

By ThinkReliability Staff

146 workers were killed when a fire raced through the Triangle Company, which occupied the top three floors of a skyscraper in New York City.  The workers were unable to escape the fire.  We can examine this incident using a Cause Map, a visual form of root cause analysis, which allows us to diagram the cause-and-effect relationships that led to organizational issues – in this case, the death of 146 workers.

On March 25, 1911 at approximately 4:40 p.m., a fire began on the 8th floor of a New York City skyscraper (one of three floors housing the Triangle Waist Company).  Although it’s not clear what sparked the fire (cigarettes and sewing machine engines are likely heat sources), a large amount of accumulated scraps (last picked up in January) provided plenty of fuel.  There were no sprinklers and the interior fire hose was not connected to a water source.  The fire spread quickly and burned for approximately a half an hour before firefighters extinguished it.

During that half-hour, 146 workers, mostly young women, were killed.  Nearly all of these workers were from the 9th floor of the building.  Workers from the 8th and 10th floor were able to escape to the ground or roof using the stairs, but one of the access doors on the 9th floor was locked.  This left only one set of stairs and elevators, which did rescue many but were overcrowded and the elevator machinery eventually failed due to heat.  Many attempted to escape using the fire escape, which was not built for quick escape (in fact, experts determined it would take 3 hours to reach ground from the Triangle Company floors) and eventually collapsed due to the collective weight, killing those on it in the fall.

Many workers jumped from the 9th floor, but the force of the fall was too great for the fire nets, which mainly broke and the jumpers died.

People were horrified at the conditions in the factories that resulted in these deaths.  In the following years, public outcry resulted in many workers’ rights improvements, including many advances in regulations regarding fire protection and working conditions.  However, these types of issues continue in other countries that have not defined such requirements.

To view the Outline and Cause Map, please click “Download PDF” above.  Or click here to read more

Deadly Stage Collapse at State Fair

By Kim Smiley

On August 13, 2011, a stage at the Indiana State fair collapsed, killing seven and injuring dozens more.  The accident occurred just before 9 pm as a crowd waited to watch the popular country band Sugarland perform.

Why did the stage collapse?  What caused this tragic accident to occur?

This incident can be analyzed by building a Cause Map, an intuitive, visual format for performing a root cause analysis.  The first step when beginning a Cause Map is to determine what goals have been impacted.  In this example, the focus will be on the safety goal since there were fatalities and many injuries.  Once the impact is determined, the Cause Map is built by asking “why” questions to determine what causes contributed to the accident.

In this example, people were killed and injured because they were near the stage and the stage collapsed.  They were near the stage because they were waiting for a concert and the area had not been evacuated.  The area had not been evacuated because the decision to evacuate wasn’t made in time.  The decision didn’t happen in a timely manner because it wasn’t clear who had the authority to make the decision because there was not an adequate emergency plan in place.  The bad weather wasn’t a surprise.  The storm was being monitored and the National Weather Service had issued a warning, but the decision to evacuate wasn’t made until too late to prevent the tragedy.

Recently findings by investigators determined that the stage collapsed because it wasn’t up to code.  The structure was required to be able to withstand winds up to 68 mph, but the stage collapsed at winds below this limit.  Investigators determined that the lateral supports were inadequate and the stage wasn’t strong enough to stand up to the wind.  The stage also wasn’t inspected because it was a temporary structure and they are not required to be inspected.

On Tuesday, (April 17, 2012)  Indiana Governor Daniels reported that he has ordered temporary outdoor structures to be inspected by the Indiana Department of Homeland Security to help prevent a similar accident in the future.

To view a high level Cause Map of this incident, click “Download PDF” above.

Siberian Plane Crash

By ThinkReliability Staff

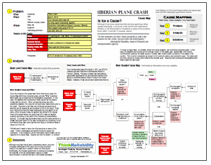
Four minutes after take-off on April 1, 2011, an ATR-72 crashed just past Roshchino International Airport in Tyumen, Siberia.  This type of plane has had previous issues with dealing with ice, and has been banned from flying in conditions likely to result in icing in the United States.  However, it has not yet been determined that ice was related to the crash.

To begin a Cause Map – an intuitive, visual root cause analysis – we look at the impacted goals.  In this case, the fatalities and injuries are the primary impact, to the safety goal.  Additionally, this incident, combined with previous air safety issues in Russia (such as the September 2011 crash that killed a Russian hockey team), have eroded public confidence in air safety in the country.  This could be considered an impact to the customer service and production goal.  The plane split into three pieces on impact, which affects the property goal.   Searches and subsequent investigations will likely impact the labor goal.

Once the impacts to the goals have been determined, begin the Cause Map with these impacted goals, and ask “Why” questions.  More detail can be added as the investigation progresses.  In this case, the fatalities and injuries were likely caused by the plane’s impact with the ground.  Other mechanical issues are still a possibility; however, the crew did not report any malfunctions prior to the crash.  Disruption of air flow over the wings and jamming of ailerons can be caused by accumulation of ice on the plane.  It has been determined that there was inadequate de-icing agent on the plane, either because it was not applied (according to the deputy head of the airport where the plane took off) or was not applied properly (according to the head of the Russian air transportation agency).  It is known that the weather was cold (the plane landed in a snowy field) and that ATR-72s have trouble with icy conditions, to the point where they have been banned from flying in conditions likely to cause ice in the US.

Officials aren’t ready to name the icing issues as a cause of the crash.  Further investigation will determine which causes did contribute.  In the meantime, all the information that is known can be captured on a Cause Map.  Causes can then be added – or crossed off – as more information becomes available.

To view the Outline and Cause Map, please click “Download PDF” above.

Deadly Train Collision in Poland

By Kim Smiley

On March 4, 2012, two passenger trains collided head-on near Szczekociny, Poland killing 16 and injuring 58.  It was Poland’s deadliest train crash in 20 years.

An investigation is underway to determine what caused the deadly accident, but an initial Cause Map can be built now and more details can be added as information becomes available.  A Cause Map is a visual root cause analysis format.  The first step in the process is to determine which organizational goals were not met and in this example the obvious goal to focus on is the safety goal.

The safety goal wasn’t met because there were fatalities and injuries.  This occurred when two trains crashed because they were traveling on the same track in opposite directions.  It’s not clear exactly how the trains ended up on the same track, but it appears human error was involved since prosecutors have announced plans to charge a controller for unintentionally causing the accident.  Media reports have also stated that the routing mechanism for one of the trains was set incorrectly so that it was sent down the wrong track and into the path of the other train.  As with any investigation that leads to human error, more information will be needed about why the mistake was made in order to fully understand why the accident occurred and determine what would be needed to prevent a similar one in the future.  In this case, we can also assume that the accident was caused by inadequate oversight of the controller or lack of a double check of the mechanisms because an ideal system won’t allow one single mistake to result in a deadly accident.

Another fact worth considering is that the rail system in Poland is in the midst of a massive modernization effort.  Poland’s rail system is being modernized to prepare for the huge crowds expected to travel to the Euro 2012 soccer championship this July.  The modernization effort has been possible in part because of subsidies offered by the European Union, which Poland joined in 2004.  As part of the modernization, more connections have been added and more trains have been running on the track where the accident occurred.  It isn’t clear yet if any of the changes contributed to the accident, but any recent changes to a system are worth reviewing during an accident investigation.

As more information is found during the investigation, the causes can easily be incorporated into the Cause Map to capture as much detail as needed.  To view a high level Cause Map, click “download PDF” above.