Tag Archives: Explosion

8 Marines Killed During Training Exercise With Live Ammunition

By ThinkReliability Staff

Eight Marines were killed, and seven Marines and sailors were injured, as the result of the unexpected explosion of a 60 mm round inside a mortar tube during a live ammunition training exercise.  While details are still to be determined, it is known that the unexpected explosion of a mortar round led to the deaths and injuries of those participating in a training exercise with a 60 mm round inside a mortar tube.

Though details of the incident are still unknown, we can begin a Cause Map, or visual root cause analysis, diagramming possible causes which remain to be investigated.  As more information becomes available, evidence supporting or excluding potential causes is included on the Cause Map.

We capture the What, When and Where of the incident in the Problem Outline.  In this case, a training accident/ explosion occurred on March 18, 2013 at about 10:00 pm at the Hawthorne Army Depot in western Nevada.  At the time, a mountain training exercise with live ammunition was using a 60 mm round inside a mortar tube.  A traffic accident that may be related has been mentioned in the news, but no detail has been provided.  To ensure that this line of inquiry is followed during the investigation, we can include it in the “different, unusual, unique” line of the problem outline.

Data that is known, such as the types of damage resulting in deaths and injuries, is included with supporting evidence, in this case testimony of the hospital spokesman.  Causes still to be determined, such as whether the mortar round exploded prematurely in the tube, detonated after being fired, or whether more than a single round exploded are included with question marks and joined by “OR”.  When evidence is obtained throughout the investigation related to a given cause, it is included directly beneath the cause it controls.  Along with the unknown method of detonation of the round, it is unknown whether an issue with the firing procedure, a malfunctioning firing device, or a malfunction in the explosive mortar is to blame.

More details should be coming soon since the use of 60 mm mortars is suspended until the review of this incident determines what happened.  At that time, those causes ruled out by evidence can be crossed off (but left on the Cause Map so that others know they were considered and ruled out as more evidence became available).

At that time, solutions that best address the issues that were causally related can be brainstormed, evaluated, and implemented.

To view the Outline and Cause Map, please click “Download PDF” above.  Or click here to read more.

Hindenburg Crash: The Importance – and Difficulty – of Validating Evidence

By ThinkReliability Staff

Since the Hindenburg explosion in 1937, theories have abounded on what caused the leaking gas and spark that doomed the airship and dozens of passengers.  We discussed some of these theories in our previous blog on the Hindenburg disaster.

In December, 2012, a documentary on the Discovery Channel used new evidence to discuss the most likely cause of the disaster.  Yep, that’s right.  76 years after the original explosion, evidence is still being gathered to help determine what really caused the explosion that killed 36 people.

Sometimes evidence is relatively easy to gather – many pieces of equipment now feed into automatic data collectors, which can provide reams of data about what happened for a specific period of time.  Sometimes, however, evidence is much harder to come by. This is especially the case with fires or explosions which frequently destroy much of the available evidence.

When evidence is hard to come by, it is difficult to determine the exact cause-and-effect relationships that led to an incident.  The best we may be able to do is capture different possibilities in a Cause Map, or visual root cause analysis, and leave the causes that haven’t been validated by evidence as possible causes, indicated by a question mark.

Sometimes, determining the exact cause(s) is important enough to result in painstaking efforts like those performed by a team at the South West Research Institute.  The team created three 1/10-scale models, not a small undertaking when the scale models are over 80 feet in length and is inflated with 200 cubic meters of hydrogen.  They then replicated scenarios described by the various theories by setting fire to, and blowing up, the models.  Additionally, they studied archive footage and eyewitness accounts to increase their understanding of the disaster.

As a result, the team now believes they have determined what happened.  Says Jem Stansfield, an aeronautical engineer and the project lead, “I think the most likely mechanism for providing the spark is electrostatic.”   The spark ignited leaking hydrogen, caused by a broken tensioning wire that punctured a gas cell or a sticking gas valve.

View the updated investigation with the recently released evidence incorporated by clicking “Download PDF” above.

Read our detailed writeup on the Hindenburg investigation.

Or, click here to read more from the blog of the on-air historian and technical advisor to the project (some really cool photos of making and destroying the models are included).

Natural Gas Explosion Kills One in Kansas City

By ThinkReliability Staff

A natural gas leak at a business plaza in Kansas City was reported to the Fire Department just prior to 5 pm on February 19, 2013.  However, the area was not evacuated until just prior to an explosion that left 1 dead and 15 injured.  The leaking gas was not shut off until 3 hours after the report.

The causes that resulted in this tragedy can be examined within a Cause Map, or visual root cause analysis.  The analysis begins by determining which goals were impacted in a problem outline, which captures the what, when and where of the incident, as well as the impact to the goals.  In this case, the safety goal was impacted due to the fatality and injuries.  The environmental goal was impacted due to the natural gas leak and the customer service goal was impacted due to an ineffective evacuation.  (How do we know it was ineffective?  Because people were still present in a building that exploded due to a gas leak that was known for almost an hour, although the timing of the ordered evacuation is not known.)  Additionally, the property goal was impacted due to the destruction of restaurant, which was the site of the explosion, and damage to adjoining properties.  Lastly, the labor goal is impacted due to the investigation by state utility regulators, which is expected to take months of painstaking work to add detail to the causes which are already known.

Once these goals have been determined, we begin with an impacted goal and ask “Why” questions to add detail to the analysis.  The safety goal was impacted due to the death and injuries.  These occurred because of the explosion AND because people were in the proximity of the explosion.  Had the explosion occurred after a complete evacuation, the injuries would have been substantially reduced, if not completely prevented, although the property goals would have still been impacted.

An evacuation ws not ordered by the fire department, who deferred to the utility company.  The utility company was slow in determining that an evacuation was needed.  There was general confusion about the responsibility for determining an evacuation.   Per the city’s emergency response plan, the Incident Commander is responsible for evacuations.  However, no Incident Commander  was named on-scene until after the explosion, as it was determined that no incident yet existed.  Because quite a bit of flexibility is generally needed in determining whether an evacuation is needed (as an evacuation itself can be dangerous), the emergency response plan is necessary somewhat confusing (in this case, contained in a 90-page document).

The explosion itself resulted from an unknown heat source within the restaurant igniting leaked natural gas.  The natural gas was leaking as a result of being struck by a boring machine being used to install fiber-optic cable in the area.  It was later determined that the contractor did not have the necessary permit for the work, though it’s not clear if that led to confusion on the location of the gas lines, or if they were mislabeled, or if it’s just that it’s really difficult to see lines when digging deep trenches using a boring machine.

The extent and probability of an explosion is related to the volume of gas released during a leak.  Had the gas been turned off earlier, the explosion might have been avoided, or lessened, reducing the impacts to all the goals.  The gas was not turned off before the explosion, and after the explosion continuing fires made the shut-off locations difficult to reach.  it’s not clear why the gas wasn’t turned off immediately, though the choice to do so  does result in other impacts, such as the loss of gas to other customers.  In cases where the true extent of the issue is not known, it is difficult to make these decisions and limit potential effects.

Because one of the issues was not knowing the extent of the leak, it has been suggested that all fire department trucks be equipped with natural gas sniffers.    Additionally, an update to the city’s evacuation protocol has been called for that would, among other changes, give authority to the first arriving public safety official  to order an evacuation, resulting some of the confusion that led to the tragedy in Kansas City.

As this example shows, it’s not only attempting to prevent these events that’s important but also ensuring that emergency plans and protocol clearly define actions to be taken as well as responsible parties.  Drills and simulations can ensure that the plans and protocols are even more effective.   This is true not only for cities and fire departments but for any organization tasked with the safety of people . . . which is to say, all of them.

To view the Outline, Timeline, Cause Map, and Solutions, please click “Download PDF” above.

Supply of Disposable Diapers Threatened by Explosion at Chemical Plant

By Kim Smiley

On September 29, 2012, an explosion at a chemical plant in Japan killed a fire fighter, injured 35 others and did significantly damage.  Chemicals produced at the plant are used in disposable diapers.  The damaged plant will be inoperable for the foreseeable future, which will likely impact the global supply of disposable diapers, a thought that strikes fear in the hearts of many parents of small children.

This incident can be analyzed by building a Cause Map, an intuitive, visual format for performing a root cause analysis.  The first step in building a Cause Map is to identify which goals were affected.  In this case, the safety goal is obviously impacted since there was a fatality and injuries.  The production goal is also a major consideration since the supply of disposable diapers is threatened because the plant will be unable to produce chemicals for a significant amount of time.  The next step is to ask “why” questions to add additional boxes to the Cause Map.

Starting with the safety goal first, we would ask “why” there was a fatality and injuries.  In this example, people were hurt because there was a fire at a chemical plant.  The fire occurred because a tank exploded and it was near other tanks full of flammable chemicals.  The tank exploded because the temperature inside the tank was increasing and it wasn’t cooled in time.  It isn’t clear yet why the temperature was increasing inside the tank, but investigators are working to find the cause.  Once it is known, it can be added to the Cause Map.

At the time of the explosion, efforts were underway to cool off the tank, but they weren’t effective.  Firefighters were working to spray down the tank with cool water to help lower the temperature, but the temperature rose too quickly.  This is also a cause of the fatality.  A fireman was working to connect spray lines near the tank at the time it exploded and he was sprayed with hot chemicals.  Other injuries occurred at the time of explosion and others were sustained during the effort to fight the fire.  It’s possible that one of the reasons that the workers were unable to cool the tank was that the usual method of cooling the tank, injecting nitrogen to decrease the oxygen and control the chemical reactions occurring, might not have been functioning properly.  This is another area that can be clarified on the Cause Map as more information is known.

Looking at the production goal now, a potential shortage of disposable diapers may occur as a result of this accident because the plant produced a significant amount of a chemical used in manufacturing diapers.  This plant produced 20% of world’s supply of one chemical in particular needed for diapers.  Combine this with the fact that the other plants manufacturing this chemical are already operating at maximum capacity and the supply will likely be less than the demand.

The final step in the process is to use the Cause Map to develop solutions to help prevent similar problems from occurring in the future.  It’s premature to discuss specific solutions in this example since the investigation is still ongoing, but the initial Cause Map can easily be expanded and used when all the information is available.

Deadly Sawmill Explosion

By ThinkReliability Staff

An explosion and subsequent fire at a sawmill in British Columbia has killed two workers and injured two dozen more.  Although the cause of the explosion is not known, there have been five explosions linked to wood dust in British Columbia since 2009.

A dust explosion results from the presence of combustible dust, such as that created by the sawmilling process.  In order for an explosion to occur, the dust must be dispersed into the air but confined by a structure in the presence of oxygen and a spark.  (Learn more about dust explosions.) 

To view all the causes that contributed to this tragic explosion, we can examine the incident in a Cause Map, or visual root cause analysis.  We begin with the impacts to the goals. The employee deaths and injuries are an impact to the safety goal.  This is the primary focus of any issue that results in human death or injury.  In addition, the environmental goal was impacted as the smoke migrated to the nearby town.  The production goal was impacted due to the shutdown of the facility.  The property goal was impacted due to destruction of the sawmill, log processing facility, and sorting facility.  Lastly, the investigation and cleanup will impact labor goals.

Once we have determined the impacts to the goals, we can ask why questions to determine the cause-and-effect relationships that led to the incident.  In this case, the injuries were due to the fire.  The fire may have been caused by a dust explosion (explosion due to natural gas leak has been ruled out).  In order for a dust explosion to occur, five factors are necessary: 1) presence of combustible dust, 2) oxygen, 3) dust is dispersed into the air, 4) dust particles are confined, and 5) the mixture is ignited.

In this case, the ignition source is not known and, due to the damage at the facility, may never be conclusively determined.  Similarly, the cause that resulted in the dust being dispersed may also not be known.  The oxygen must be present for worker safety and the dust is confined because it is held within a closed structure.  The dust is present because it is created during sawmilling operations.  What makes a dust combustible depends on the properties of the dust.  This mill was processing pine beetle wood, or wood that was ravaged by beetles.  This makes the wood drier, which results in a drier, finer, more combustible dust.  Thorough cleaning of any facility that creates potentially combustible dust is a necessity – inadequate cleaning (including dust that may gather on hard-to-access surfaces, such as the ceiling) increases the possibility of an explosion.  The union believes that cleaning has been reduced as a result of the economy.

Local government has begun inspections of saw mills but are asking plants to examine potential dust and ignition sources. Reducing dust and ignition sources are the most effective way to reduce risk of dust explosions.  Other solutions being considered include adding water to the air to increase humidity and increased ventilation, which can reduce the confinement of the dust and increase cleanliness.

To view the Outline and Cause Map, please click “Download PDF” above.


Combination of Gas Leak and Flare Could be Disastrous

By ThinkReliability Staff

A leak from the Elgin platform in the north sea near Aberdeen has the potential to cause an explosion due to the proximity of the leak to the still-lit flare on the platform.  However, the wind is currently blowing gas away from the flare.  The potential for environmental damage is not as great as that of Deepwater Horizon because it is a surface, rather than underwater, leak.

Workers on the now-evacuated Elgin rig noticed the leak on March 25, 2012.  The rig was partially, then later fully, evacuated.  We can examine the causes of the environmental leak, as well as the potential for further damage, in a visual root cause analysis in the form of a Cause Map.  The Cause Map lays out the cause-and-effect relationships in a clear, intuitive way.

We begin with the impacts to the goals.  The safety goal is impacted because of the potential for an explosion.  The environmental goal is impacted due to the gas leak, estimated to be approximately 200 cubic metres per day.  The customer service goal is impacted due to the loss of value of the owner corporation stock shares.  Production is currently shut down on the rig, leading  to an impact to the production goal.  The potential for an explosion could also cause catastrophic damage to the platform, which is an impact to the property goal.  Lastly, the evacuation of the platform is an impact to the labor goal.

In order for an explosion to occur, there must be fuel, oxygen, heat and confinement.  In this case, the oxygen is provided by the atmosphere, and the confinement is provided by the well itself.  The fuel is provided by the gas leak, believed to be entering from another non-producing well through a crack in the outer casing of the well, which was in the process of being plugged and abandoned.    The heat likely to cause the explosion is a flare on the platform.  The flare burns off excess gas from the platform and was not extinguished during the evacuation, as the priority was to remove the workers.

The flare is unable to be turned off remotely, but options for extinguishing the flare are being evaluated.  Other options being evaluated to stop the leak and reduce the potential for explosion include digging a relief well or killing the well that is currently leaking.  All options have the potential to be very expensive.

To view the Outline and Cause Map, please click “Download PDF” above.

School Leveled by Gas Explosion

By Kim Smiley

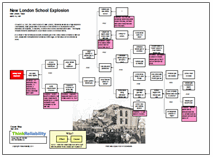
On March 18, 1937, the London School of New London, Texas was leveled by a huge explosion.  Unfortunately, many people were in the school on the afternoon of the explosion and an estimated 280 students, 15 teachers, 2 visitors and a school secretary were killed.  This tragedy remains the worst catastrophe to occur inside a school in American history.

The cause of this tragic incident can be investigated by building a Cause Map, a visual root cause analysis, which shows the cause and effect relationships between the different factors that contributed to the explosion.  A Cause Map begins by determining which goals were impacted and in this example the safety goal is the obvious focus.  Causes are then added to the Cause Map by asking “why” questions to add additional information.  In this example, the safety goal was impacted by the large number of fatalities.  The deaths occurred because the school was occupied and the school was destroyed.

The school was destroyed because there was a large natural gas explosion.  The explosion occurred because there was a large quantity of natural gas in the school and a shop teacher turned on a sander and created a spark.  The gas was in the school because there was a leak, there was a large quantity of gas was trapped in a void space under the school and the gas leak wasn’t detected.  The investigation into this incident was never able to decisively determine what caused the natural gas leak.  The void space was under the school because the school was built on a slope.  The leak wasn’t detected because the school was using untreated natural gas which is both invisible and odorless.

Why was the school using untreated natural gas?  The school was trying to save money by eliminating their heating bill.  The school was located near oil fields and had tapped into a nearby residue gas line to provide heat, saving approximately $300 dollars a month.  Using free untreated natural gas was a common practice in the region.  The gas company turned a blind eye since natural gas was considered a waste product of oil drilling that was just flared off.

The end result of using free, but untreated natural gas was that no one could detect that the school was filled with natural gas.  One spark and the whole school was destroyed along with many, many lives.

As a result of this horrendous accident, all natural gas in the United States is treated to have an odor, usually with mercaptan which smells like rotten eggs, so that leaks can be detected by smell.

Explosion at Nuclear Waste Site Kills One

By Kim Smiley

An explosion at a nuclear waste processing site in France killed one and injured four workers on September 12, 2011.  The investigation is still ongoing, but it is still possible to create a Cause Map, a visual root cause analysis, that contains all known information on the incident.  As more information becomes available, the Cause Map can easily be expanded to incorporate all relevant details.  One advantage of Cause Mapping is that it can be used to document all information at each step of the investigation process in an intuitive way, in a single location.

When the word “nuclear” is involved emotions and fears can run high, especially following the recent events at the Fukushima nuclear plant in Japan.  This incident is a good example where providing clear information can help calm the situation.  The explosion in France happened when a furnace used to burn nuclear waste failed.  The cause of the explosion itself isn’t known at this time, but there is some relevant background information available that helps explains the potential ramifications of the explosion.

The key to understanding the impact of this incident is the type of nuclear waste that was being burned.  According to statements by the French government, the furnace involved was only used to burn waste with very low level contamination.  It burned things such as gloves and overalls as well as metal waste like tools and pumps.  No objects that were part of a reactor were treated in the furnace.  There are also no reactors at the site that could be potentially damaged by explosion.

There was no radiation leakage detected and the potential for large amounts of released radiation wasn’t there based on the type of material being processed.  It was a horrible accident that resulted in a death and severe injuries, but there was no risk to public health.

How France views nuclear power is also a bit of background worth knowing.  France is the world’s most nuclear power dependent country.  Fifty-eight reactors generate nearly three fourths of France’s power.  France is also a major exporter of nuclear technology.  The public relations issues associated with a nuclear disaster in France would be very complicated.

Once the investigation into this incident is complete, solutions can complete be determined and implemented to help prevent any future occurrences.

Changing the Emergency Response Process

By ThinkReliability Staff

When Line 132 ruptured last September in the community of San Bruno, California, emergency personnel were quick to respond to the natural gas explosion.  The first fire truck was on scene within six minutes of the explosion.  What responders found was a chaotic scene, with multiple wounded and killed and swaths of the neighborhood in flames or simply flattened.  Little did they know that a large natural gas transmission line, feeding the spreading fire, was directly beneath them.  Emergency personnel did their best to clear homes and evacuate the wounded as the fire spread, but the confusion continued for nearly 90 minutes until the gas valves were shut off upstream from the fire.

The subsequent National Transportation Safety Board (NTSB) investigations focused on Pacific Gas and Electric (PG&E) processes following the accident, and found that PG&E was woefully unable to respond quickly to a crisis of this magnitude.  As a set of timelines show, emergency response personnel were already on scene long before PG&E was even aware that a pipeline rupture may be associated with a local fire.  PG&E apparently did not notice an alarm warning them of a pressure drop.  Control systems detected a severe pressure drop approximately four minutes after the disruption; however the PG&E gas control center, located in San Francisco, remained unaware of the explosion and fire until a PG&E dispatch center in Concord called them.  Off duty employees had called-in to the Concord dispatch center 7 and 11 minutes after the incident, alerting them of a large fire in San Bruno.  However it was not until the dispatch center called the gas control center 16 minutes after the explosion that gas control operators realized what was happening.  By this point emergency responders had already arrived at the scene, unaware of the large natural gas pipeline directly under the neighborhood.

What information did emergency responders have as they arrived on scene that day?  Although PG&E itself was aware of the likely service disruption, they failed to notify first responders of any potential danger in those critical minutes after the explosion.  Additionally according to NTSB testimony, the fire department was unaware of the large natural gas pipeline under the community.  Larger transmission pipelines have different operating characteristics than smaller distribution pipelines, including different recommended safety precautions and shut down times.  With a better awareness of the pipeline locations and associated dangers, emergency response personnel could have developed training and response procedures ahead of time for an explosion of this magnitude.  PG&E has since taken steps to enhance its partnership with first responders and other public safety organizations.  Clearly there are other steps that need to be taken as well.

When conducting an investigation, a timeline can be a helpful tool to organize information.  While straightforward to build, timelines can identify areas needing more research and aid in building a process map and a Cause Map.  Compare what happened at PG&E to what emergency responders were doing.  You’ll notice there was a significant delay at PG&E in recognizing there was a problem and then acting upon it.  It took nearly 90 minutes to close valves to shut transmission lines.  Changes must be made to speed up PG&E’s procedures in a crisis situation.

Likewise process maps are a useful tool for determining where a process can use improvement.  In the Current process map, it is noticeable that there are three parallel processes occurring, where information is not being shared in an efficient manner.  The PG&E Dispatch Center only shares information with the Emergency Dispatch Center after they have fully assessed the situation.  This information might come after the fact, as it did in San Bruno, or seriously delay an effective response by EMTs and firefighters.  Going one step further, trained emergency personnel might be able to check with local utilities if they have reason to suspect a natural gas pipeline is involved.  Simple procedural changes, such as who is notified and when, can have significant impacts.

It is important to note that the timeline helps create the most accurate “As Occurred” process map (called Current in this case).  Procedures can differ from actual processes, so it is important to document what actually happened, identify differences in what should have occurred, and figure out why it didn’t.  In this case, PG&E’s procedures were followed and need to be revised.

The NTSB recommendations will undoubtedly lead to multiple changes.  It is easy to focus on material solutions, which tend to be expensive to implement.  Some changes under consideration are the use of remote controlled valves and the replacement of aging pipes.  While there is no doubt that these changes need to happen, other changes can help in the meantime.  Process maps can help identify procedural changes which may be much less expensive, such a modifying notification procedures.

A detailed Cause Map built after the preliminary investigation shows what NTSB investigators believe led the natural gas leak.  More information on the NTSB investigation can be found here.

The Side Effects of Fracking: Explosive Water?

By ThinkReliability Staff

America’s push for clean energy has certainly been a source of intense debate – the safety of off-shore drilling, the hidden costs of ethanol subsidies, even the aesthetics of wind farms.  New evidence is set to increase the intensity on yet another topic – the debate over hydraulic fracturing.

Hydraulic fracturing is a process where internal fluid pressure is used to extend cracks, or fractures, into a rock formation.  It can occur in nature, but in man-made operations fractures are made deep in the earth by pumping fluid (mostly water) and a proppant (such as sand) out the bottom of a well.  The proppant prevents the fracture from closing back up after the injection of fluid stops.  Chemicals are sometimes added to the pumping fluid to aid in the process.  These fractures allow the gas or liquid trapped in the rock formation to flow back through the fracture, up the well and out for production.

More commonly known as “fracking”, the technique is used to release natural gas from shale rock formations.  These formations, especially common on the East Coast and in Canada, have provided thousands of new, well-paying jobs.  Fracking has allowed natural gas companies to access enormous reserves of natural gas, previously thought inaccessible and prohibitively expensive to drill.  In fact fracking has allowed drillers to tap what is potentially the world’s largest known reserve of natural gas in the Marcellus and Utica shale deposits, stretching from New York to Georgia.

As with any new technology however, there are potential consequences.  Lawmakers and regulators have debated the safety of the largely unregulated fracking industry, but with little definitive evidence either way…until now.  A study by Duke University has concluded that fracking does indeed lead to methane contamination in drinking water.  Methane is the primary component in natural gas and is not lethal to consume.  However, high concentrations are explosive.

The study determined that fracking causes methane to leak into drinking water.  Water sources within a kilometer were found to have significant levels of methane, more than 17 times higher than wells located further from drilling sites.  Furthermore, it was determined that the source of the methane was the much older methane released from the bedrock, versus newer methane produced naturally in the environment.

The exact reason for this is unclear, but a Cause Map can lay out the possible areas needing further investigation.  For instance, the frack chemicals might enter the water supply accidentally during the drilling process.  Spills could also contaminate surface water, or chemicals could migrate into the water supply.

The study indicates that chemical migration is most likely what’s happening.  Surface spills, which have happened, are not a major contributor to the wide-spread methane contamination; so that cause can be left in the Cause Map but won’t be investigated further for our purposes.  Furthermore, the study produced no evidence that the drilling process itself was causing the contamination; so that block can be crossed off the Cause Map.

That leaves one possibility – migration.  The chemicals (including methane) could migrate in two different ways – through the well casing or through the bedrock.  The study’s authors felt it was unlikely that chemicals were migrating thousands of feet through bedrock, so migration from well casings experiencing high pressure flow  is more probable.  While more evidence is needed, it is possible that the well casings are weakened by the fracking process which pushes sand through the casings at high pressure.

An EPA study looks to definitively determine fracking’s impact on drinking water, and specifically human health.  However that study is not scheduled to be completed until 2014.  Until then, lawsuits and tighter regulations are likely to dominate headlines.