Tag Archives: Cause Mapping

Washing Machine Failure

(This week, we are proud to announce a Cause Map by a guest blogger, Bill Graham.  Thanks, Bill!)

While completing household chores in the spring of 2010, a Housewife found her front load washing machine stopped with water standing in the clothing.  Inspection of the machine uncovered the washing machine’s drain pump had failed.  Because the washer is less than two years old, it was decided to attempt repair of the machine instead of replacing it.  A replacement pump was not locally available, so the family finds and orders a pump from an Internet dealer.  Delivery time for the pump is approximately one week, during which time the household laundry chore cannot be completed and some of the family’s favorite clothing cannot be worn because it is has not been laundered.  On receiving the new pump, Dad immediately removes the broken pump and finds, to his chagrin, a small, thin guitar pick in the suction of the old pump.  Upon discovery of the guitar pick, the family’s children report that the pick had been left in the pocket of the pants that where being washed at the time of the pump’s failure.  The new pump was installed and the laundry chore resumed for the household.

While most cause analysis programs would identify the guitar pick as the root cause to the washing machine’s failure, Cause Mapping unveils all of the event’s contributing factors and what most efficient / cost effective measures might be taken to avert a similar failure.  For example, if all the family’s children aspire to be guitar players, then a top load washer may better suit their lifestyle while also averting the same mishap.  Or, maybe the family should consider wearing pocket-less clothing.  Or, maybe all family members should assume bigger role in completing the household laundry chore.  Whichever solution is chosen, the impact of these and all contributing causes is easily understood when the event is Cause Mapped.

Dissecting Safety Incidents: Using root cause analysis to reveal culture issues

By ThinkReliability Staff

The objective of a root cause analysis investigation is to prevention.  The causes of an incident are investigated, so that solutions can be developed and implemented, to reduce the risk of the same or a similar problem from occurring.  The process sounds easy, but in practice it can become more involved.  For example, what do you do when one of the identified causes is “lack of safety culture”?  How exactly do you solve that?

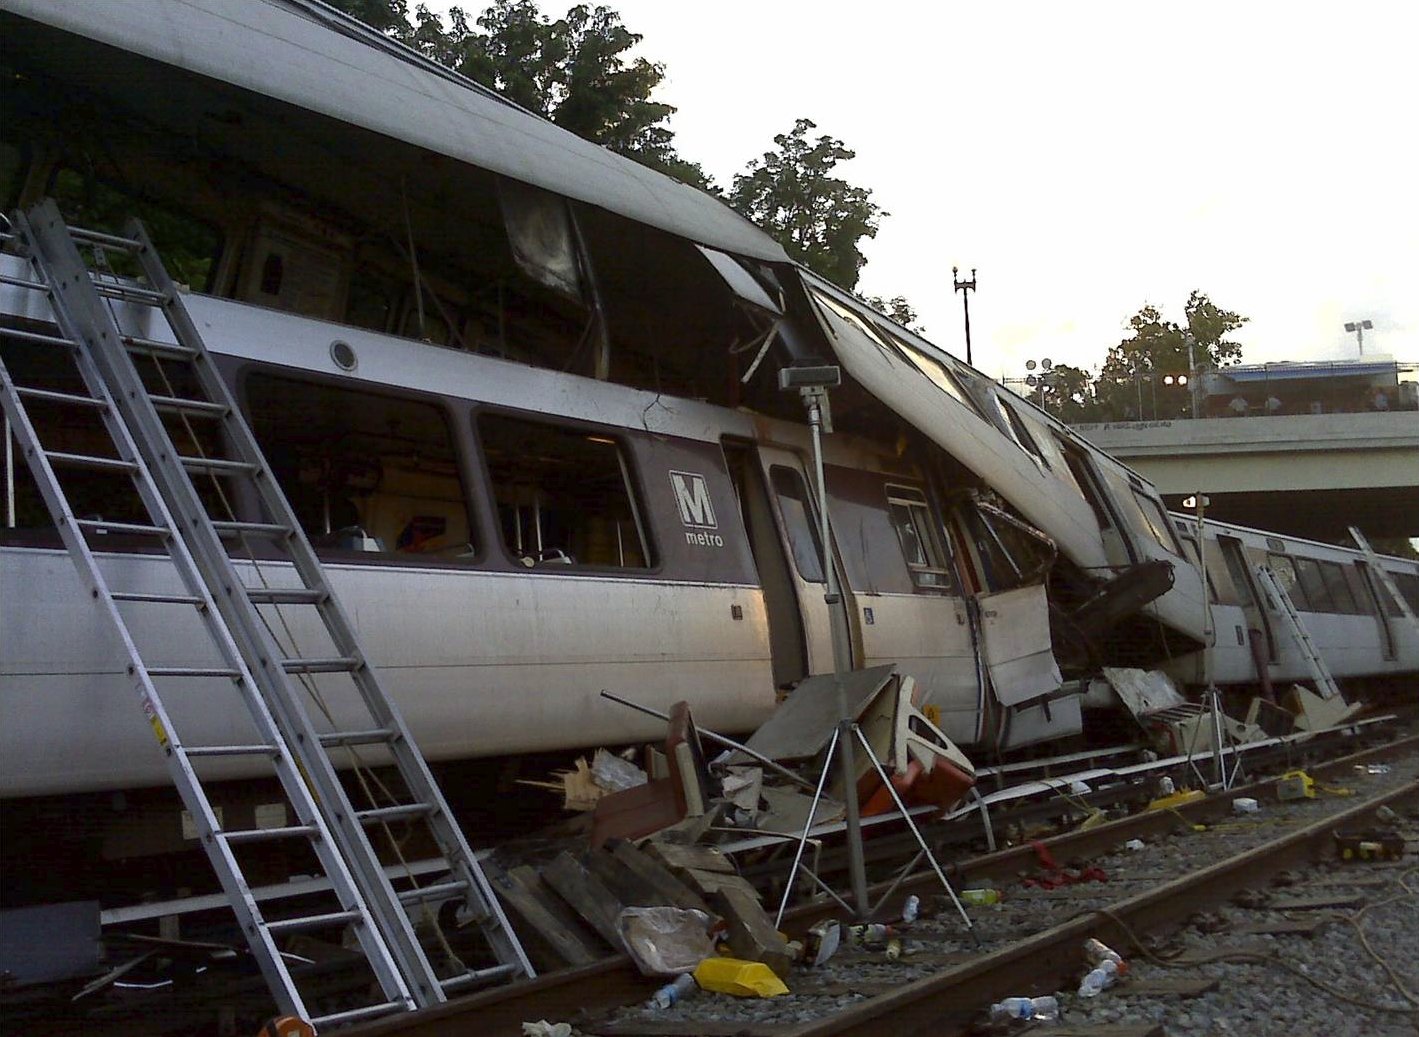
This is the issue that the Washington DC Metrorail (Metro) is currently facing.  The National Transportation and Safety Board (NSTB) recently released findings from the investigation of a DC metro train crash that killed nine last June.  (See our previous blog for more details). Predictably, the NSTB findings include several technical issues including failed track circuits and lack of adequate testing, but the list of causes also includes items like lack of safety culture and ineffective oversight.

Fortunately, the NSTB also provided recommendations such as developing a non-punitive safety reporting program, establishment of periodic inspections and maintenance procedures for the equipment that failed during this accident, and reviewing the process used to pass along safety and technical information.  One of the important things to notice in this example is that the recommendations are fairly specific, even if the stated cause is a little vague.  Specific solutions are necessary if they are going to be effectively implemented.

If you find yourself at a point in your organization where a cause is identified as “lack of safety culture”, it’s a good idea to keep asking why questions until you identify the specific problems that are causing the issue.  Is it the safety information that is lacking or incorrect?  Is the process that provides the information confusing?  Do the workers need better safety equipment?  Knowing all the details involved will allow better solutions to be developed.  And better solutions result in lower risks in the future.  Culture is the shared values and practices of the people in an organization.  The Cause Mapping method of root cause analysis has an effective way for an organization to identify “culture gaps” by thoroughly dissecting just one of its incidents.

Spacewalk Delay for Ammonia Leak

By Kim Smiley

Astronauts at the International Space Station ran into problems during a planned replacement of a broken ammonia cooling pump on August 7, 2010.  In order to replace the pump, four ammonia hoses and five electrical cables needed to be disconnected to remove the broken pump.  One of the hoses could not be removed because of a jammed fitting.  When an astronaut was able to disconnect it by hitting the fitting with a hammer, it caused an ammonia leak.

Ammonia is toxic, so the leak impacted both the safety and environmental goals.  Because the broken pump kept one cooling system from working, there was a risk of having to evacuate the space station, should the other system (which was the same age) fail.  This can be considered an impact to the customer service goal.   The repair had to be delayed, which is an impact to the production/schedule goal.  The loss of a redundant system is an impact to the property/equipment goal.     The extended spacewalk is an impact to the labor/time goal.

Once we fill out the outline with the impact to the goals and information regarding the problem, we can go on to the Cause Map.   The ammonia leak was caused by an unknown leak path and the fitting being removed by a hammer.  The fitting was removed with a hammer because it was jammed and had to be disconnected in order for the broken pump to be replaced.  As we’re not aware of what caused the pump to break (this information will likely be discovered now that the pump has been removed), we leave a question mark on the map, to fill in later.

The failed cooling pump also caused the loss of one cooling system.  If the other system, which is near the end of its expected life, were to fail, this would require evacuation from the station.

To aid in our understanding of this incident, we can create a very simple process map of the pump replacement.  The red firework shows the step in the replacement that didn’t go well.  To view the outline, Cause Map and Process Map, click on “Download PDF” above.

Tackling Injuries in the NFL

By Kim Smiley

It’s no secret that a lot of players get hurt in the National Football League (NFL).

But why does this happen?  Why do so many players get hurt?  And what may be a better question, is there a way to prevent injuries?

This problem can be approached by performing a root cause analysis built as a Cause Map using root cause analysis software you probably already own – Microsoft Excel.

The first step is to determine how the organizational goals are impacted.  In this example, the safety goal will be considered.  The safety goal is impacted because there is a potential for injury.  Causes can then be added to the Cause Map by asking “why” questions.

Why do football players get hurt? Football players routinely slam into each other and the ground. It’s the nature of football. Even when the rules are followed, football is a very physically demanding sport with a potential for injuries to occur.

Another reason players get hurt is that they are wearing inadequate protection to prevent injury. Right now the rules only require uniforms, helmets and shoulder pads.  Most players wear very little padding because they want to maximize their speed and mobility.

As a potential solution to this problem, NFL officials are reconsidering the rules that govern the pads worn by players. Currently knee, hip and thigh pads are only recommended, but there is possibility that this will be changed for the 2011 season.

Twelve teams will experiment with lightweight pads during training camps and preseason games this year.  The players will have the option to continue wearing the pads during the actual season if they want.

Depending on the outcome of the trials, there is the possibility that additional padding will be mandatory starting in the 2011 season.  Hopefully, the additional padding will be successful at preventing some injuries, but only time will tell.

Impure Injections Used

By Kim Smiley

Research is been suspended at a prominent brain-imaging center associated with Columbia University.  Food and Drug Administration investigations found that the Kreitchman PET (positron emission tomography) Center has injected mental patients with drugs that contained potentially harmful impurities repeatedly over the past four years.

Investigations by the lab determined that no patients were harmed from the impurities, but this is still a significant issue in a nationally renown laboratory.

How did this happen?

This issue can be investigated by building a root cause analysis as a Cause Map.  To start a Cause Map, the impact to the organization goals is determined.  In this example, this issue is obviously an impact to safety because there was potential to harm patients.  It is also an impact to the production-schedule goal because research has been suspended.  Additionally, this problem is an impact to the customer service goal because this issue raises questions about the validity of research results.

To build a Cause Map, select one goal and start asking “why” questions to add causes.  In this case, the first goal considered will be the safety goal.  There was a potential for injury.  Why?  Because impure injections were given to patients.  Why?  Because the injections are necessary for research, because the labs typically prepare the compounds themselves and because the lab prepared the compounds incorrectly.  When there is more than one causes that contributed, the causes are added vertically with an “and” between them.

Each impacted goal needs to eventually connect to the same Cause Map.  If they do not, the impacted goal may not be caused by the same problem and the goals should be revisited.

To continue building the Cause Map, keep asking “why” questions for each added cause until the level of detail is sufficient.

A Cause Map can be as high level or as detailed as needed.  The more significant the impact to the goals, the more likely a detailed Cause Map will be warranted.  Once the Cause Map is completed, it can be used to develop solutions to help prevent the problem from reoccurring.

In this example, the lab is currently changing management and reorganizing procedures to help prevent the similar problems in the future.

To view an initial Cause Map for this issue, please click the “Download PDF” button above.

Containment Cap Removed from Gulf Oil Leak

By ThinkReliability Staff

Last Wednesday, another set back occurred in the attempt to stem the flow of oil in the Gulf of Mexico from the a well head that was damaged when the Deepwater Horizon Oil Rig exploded on April 20 and sank 36 hours later .

The containment cap used to siphon oil from the damaged well head for the last three weeks had to be temporarily removed for more than 11 hours.  Before being removed, the containment system was sucking up about 29,000 gallons an hour.

So what happened?  Why remove a containment cap that had been working successful?

A root cause analysis of this problem can be built as a Cause Map.  A Cause Map is started by considering the impact to the goals and asking “why” questions to add Causes.  In this example, the first goal we will consider is the Environmental Goal.  Obviously, the environmental goal is impacted because there was additional oil released to the environment because the cap was removed.

Continuing to ask “why” questions we can add additional causes.  The cap was removed because the ship connected to the containment cap system needed to be moved away from the well because there a safety concern because of the potential for an explosion.

There was an explosion concern because there was evidence that flammable gas was flowing up from the well head because liquid was being pushed out of a valve in the containment system.  This gas was getting into the containment cap system because an underwater vent was bumped by one of the remote-controlled submersible robots being used to monitor the damaged well.

More detail could be added to the Cause Map by continuing to ask why questions.  The detailed Cause Map could then be used to develop solutions that could be implemented to help prevent the problem from reoccurring.

Click on the “Download PDF” button above to view an initial Cause Map.

The containment cap was put back into place around 9 pm on June 23.  The efforts to contain and clean up the oil spill will continue for months and possibly years to come, but at least this small issue has been fixed.

Mine Explosion in Colombia

By Kim Smiley

A coal mine explosion in Amaga, Colombia on June 16, 2010 has left at least 18 dead, 1 injured and at least 53 people unaccounted for, and presumed dead.  The deaths and injuries resulted from a fireball caused by an explosion.

Every explosion is caused by four factors: heat, fuel, oxygen and confinement.  In this case, the fuel was methane gas that had built up in the mine.  Methane is naturally produced as a byproduct of coal mining.  The methane was not removed from the mine because the mine lacked a methane ventilation pipe.  Additionally, the workers at the mine did not realize that methane levels were high because there was no gas detection system at the mine.

The number of dead and missing is so high because more people than usual were at the mine – the explosion happened during shift change.  Rescue efforts have been delayed by the high levels of gas in the mine, further increasing the number of deaths.

By clicking “Download PDF” above, you can view the thorough root cause analysis built as a Cause Map in a simple, intuitive format that fits on one page.

Even more detail can be added to this Cause Map as the analysis continues. As with any investigation the level of detail in the analysis is based on the impact of the incident on the organization’s overall goals.

Known Terror Suspect Boards Plane

By Kim Smiley

On May 1, 2010 authorities found a car bomb in a smoking Nissan Pathfinder in Times Square in New York City (NYC). The bomb had been ignited, but thankfully failed to explode and was disarmed before any damage was done.

The vehicle identification number (VIN) number had been removed from the dashboard and the door sticker, but police retrieved it from the bottom of the engine block.  The VIN was used to identify Faisal Shahzad as the person who recently purchased the car.  The investigation used this evidence in addition to other information to identify Mr. Shahzad as a suspect in the car bomb attempt.  Early in the afternoon of May 3, his name was added to the no-fly list and an email notification was sent to airlines.  In order to view the new name, airlines would have needed to check a website for the most recent no-fly list.

As the investigation continued, Shahzad was put under surveillance, but somehow eluded authorities and drove to JFK airport in NYC undetected.  The evening of May 3, he bought an airline ticket and was able to get through security and board a plane traveling to United Arab Emirates.  He boarded the plane approximately seven hours after his name was added to the no-fly list.

Luckily, investigators learned that Shahzad was on the plane when a final passenger list was sent to officials at the federal Customs and Border Protection agency minutes before takeoff.  He was apprehended before the plane took off and is now in custody.

How was a suspect on the no-fly list allowed to board a plane headed overseas?

A root cause analysis built as a Cause Map can be used to analyze this incident.  This incident is an impact to the Safety goal because a known terror suspect on the no-fly list nearly left the country.  The Cause Map can be built by starting at the impacted goal and asking why questions to add causes.  In this example, the suspect nearly got away because he was allowed to buy a ticket and got through security.  This happened because the airline was using an outdated version of the no-fly list that didn’t include the name because it had recently been added to the list.

There are still a number of causes that are unknown in this case, but an initial Cause map can be viewed by clicking on the “Download PDF” button above.

Oil Rig Explosion

By ThinkReliability Staff

On April 20, 2010 about 10 pm a huge explosion rocked a semi-submersible drilling oil rig about 40 miles off the coast of Louisiana in the Gulf of Mexico. The oil rig was called the Deepwater Horizon and was owned by Transocean Ltd and leased to the British Petroleum Company through September 2013.

The oil rig burned for about 36 hours before sinking.  126 people were on the oil rig at the time of the explosion.  Eleven are missing and presumed dead and 4 were critically injured. Oil continues to leak from the wellhead more than a mile underwater on the ocean floor at an estimated rate of 42,000 gallons a day.

Remotely operated submersible vehicles were used to examine the wellhead.  The vehicles were also used in an effort to manually trigger the blowout preventer, which would close the wellhead and prevent any farther release of oil.  The blowout preventer is a 450-ton valve installed at the wellhead that is designed to automatically shut to prevent oil leaks in the event of an accident.  Attempts to manually close the blowout preventer have not been successful.

The other containment options being explored are drilling a separate well nearby to plug the flow at a location below the blowout preventer and building underwater domes that would contain the oil until it could be safely pumped to the surface for disposal.  Both of these alternatives are being actively worked and will take months to complete.  It is estimated that 4.2 million gallons of oil will be released if the blowout preventer is not able to be closed.

The cause of the explosion is unknown at this time.  An investigation is underway by the Coast Guard and the Minerals Management Service.

A preliminary root cause analysis can be started using the information that is known and details can be added as they become available.  The analysis can be documented using a Cause Map which is a simple, intuitive format that visually lays out all known causes for an incident.  The first step in building a Cause Map is to determine how the organizational goals were impacted by the incident.  Causes for each impacted goal are determined to begin building the Cause Map.

In this case, the safety goal was impacted because 11 people were killed and several injured.  The environmental goal was impacted because there was a significant oil release.  The materials goal was impacted because the $700 million oil rig is a complete loss and the production/schedule goal was impacted because the oil drilling operation is shut down.

Click on the “Download PDF” button above to view an initial Cause Map.

The Future of NASA

By Kim Smiley

A previous blog discussed a shortfall in the National Aeronautics and Space Agency (NASA) budget.  The lack of funding put NASA’s organization goals in jeopardy, including a planned return mission to the moon.  Then-President George W. Bush had tasked NASA to return to the moon five years ago and NASA has been working toward this goal since.

President Obama announced his vision for NASA during a speech Kennedy Space Center on April 15.  He canceled plans for a moon mission and redirected NASA to focus on sending astronauts to an asteroid and work toward an eventual Mars landing.  The proposed budget would boost NASA funding by six billion over the next five years.

President Obama’s plan calls for private companies to fly to the space station using their own rockets and ships, freeing up NASA resources for basic research and development of technologies for trips beyond earth’s orbit.  The final space shuttle mission is scheduled for September 2011 after which the US will depend entirely on Russia to carry astronauts to the space station until a replacement for the space shuttle is developed.  Additionally, the space station’s life would be extended by five years as part of the Obama plan.

The planning necessary to achieve a goal of this complexity is mind boggling.   There are many new technical issues to consider and brand new equipment will need to be designed.  There are many, many potential problems that could arise during this design process and mission.

Cause Mapping is often used to perform a root cause analysis of an incident that has occurred, but it can also be used to proactively approach a problem by building a map that captures failures that could happen.  Identifying potential problems before they happen would allow NASA to mitigate risks and allocate resources efficiently.

Cause Maps could be built to any level of detail that was deemed appropriate.  Cause Maps could be developed to capture all potential failure modes for something as small as a single component or for something as large the entire mission.