Tay Bridge Collapse

By ThinkReliability Staff

On December 28, 1879, the Tay Bridge in Dundee, Scotland collapsed as an express train was traveling across. All 75 people on board were killed. The bridge had been tested and approved by the Board of Trade only 19 months prior and opened to traffic just over 2 years before the collapse. The failure of the bridge also resulted in the loss of the bridge (it was rebuilt nearby) and the temporary loss of a train route. Surprisingly, there was very little damage to the train, which was refurbished and placed back in service.

Although the bridge had passed its Board of Trade testing, problems quickly started to arise. Work crews on the bridge reported severe vibrations whenever a train crossed. An inspector noticed deficient joints, but rather than reporting them, determined he could repair them himself. (Unfortunately, it helped the vibrations but further decreased the structural integrity of the bridge.) Another train crossed the bridge at 6:00 p.m. the evening of the failure and reported a “very rough” journey – the train reportedly let off sparks as it swayed and rubbed against the guardrails.
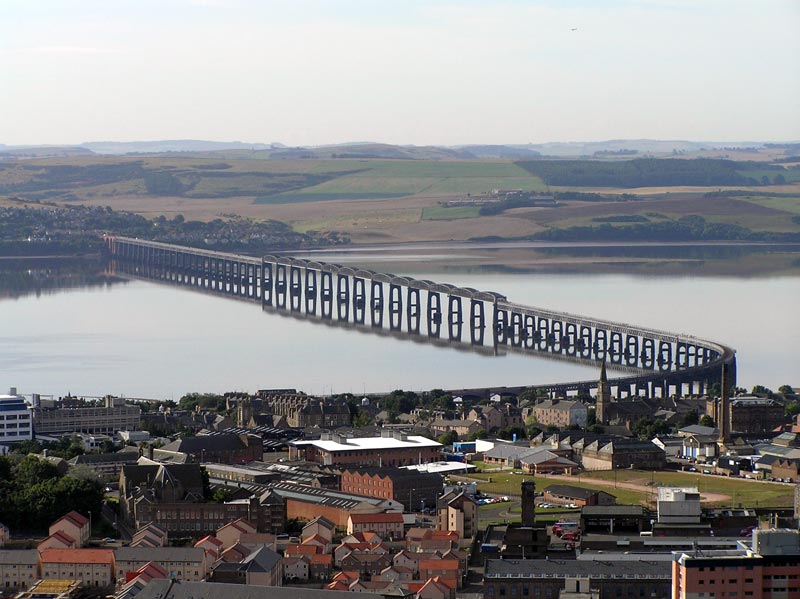
Modern Tay Bridge
Modern Tay Bridge

The train that began to cross the bridge at around 7:00 p.m. was much larger and heavier than the train that crossed at 6:00 p.m. There was also severe weather, and witnesses on the shore report an especially heavy gust of wind as the bridge began to collapse. The board of inquiry determined that the collapse of the bridge was due to the failure of the tower lugs. These tower lugs were experiencing more stress than usual, more than they were designed for, due to an increase in traffic, the heavy winds, and the particularly heavy train which was crossing at the time of failure. In addition, the lugs had been weakened by fatigue cracking caused by large lateral oscillations. The causes of the additional stress were also causes of the oscillations, along with a misalignment in the track. The defective joints – both from design and from the “fix” of the inspector – allowed the oscillations to increase over the (short) life of the bridge.

This bridge failure – still the most famous in the British Isles – did lead to some additional insight in bridge construction, including some lessons still used today. By reviewing these types of failures, we can ensure that 75 people don’t have to lose their life again to get a lesson on building structurally sound bridges. To view the Cause Map of this incident, please click on ‘Download PDF’ above.

The information used to build this Cause Map is from Failure Magazine.

Known Terror Suspect Boards Plane

By Kim Smiley

On May 1, 2010 authorities found a car bomb in a smoking Nissan Pathfinder in Times Square in New York City (NYC). The bomb had been ignited, but thankfully failed to explode and was disarmed before any damage was done.

The vehicle identification number (VIN) number had been removed from the dashboard and the door sticker, but police retrieved it from the bottom of the engine block.  The VIN was used to identify Faisal Shahzad as the person who recently purchased the car.  The investigation used this evidence in addition to other information to identify Mr. Shahzad as a suspect in the car bomb attempt.  Early in the afternoon of May 3, his name was added to the no-fly list and an email notification was sent to airlines.  In order to view the new name, airlines would have needed to check a website for the most recent no-fly list.

As the investigation continued, Shahzad was put under surveillance, but somehow eluded authorities and drove to JFK airport in NYC undetected.  The evening of May 3, he bought an airline ticket and was able to get through security and board a plane traveling to United Arab Emirates.  He boarded the plane approximately seven hours after his name was added to the no-fly list.

Luckily, investigators learned that Shahzad was on the plane when a final passenger list was sent to officials at the federal Customs and Border Protection agency minutes before takeoff.  He was apprehended before the plane took off and is now in custody.

How was a suspect on the no-fly list allowed to board a plane headed overseas?

A root cause analysis built as a Cause Map can be used to analyze this incident.  This incident is an impact to the Safety goal because a known terror suspect on the no-fly list nearly left the country.  The Cause Map can be built by starting at the impacted goal and asking why questions to add causes.  In this example, the suspect nearly got away because he was allowed to buy a ticket and got through security.  This happened because the airline was using an outdated version of the no-fly list that didn’t include the name because it had recently been added to the list.

There are still a number of causes that are unknown in this case, but an initial Cause map can be viewed by clicking on the “Download PDF” button above.

NASA Balloon and Telescope Payload Crash

By Kim Smiley

The plan for the telescope was exciting.  It was a nuclear compton telescope (NCT), built to map gamma rays, to aid in locating astrophysical objects like supernovae, pulsars and black holes.  The telescope was being launched by balloon from  Alice Springs, Australia for an optimal view.  The NCT team had been hard at work and on April 29, 2010, eagerly awaited the launch, as did news crews and other onlookers.

However, instead of delivering the telescope to nearly 25 miles above ground, the gondola carrying the telescope left the launcher awkwardly and dragged across the ground.  It hit and overturned a nearby vehicle and barely missed injuring the spectators gathered nearby.  The telescope suffered major damage.  The build team was devastated and will likely be spending considering effort and resources rebuilding or repairing it.  As a result, all balloon launches were put on hold.  (The next launch was scheduled for this month.)

Although an in-depth investigation is taking place, we can begin a root cause analysis with the information that is known so far.  The near miss of injuring onlookers is an impact to the safety goal.  The devastation of the build team is an impact to the customer service goal.  Balloon flights on hold are an impact to the production goal.  The damage to the telescope and the vehicle are impacts to the property goal.  The rebuild or repair of the telescope is an impact to the labor goal.  With these impacted goals in mind, we can begin a Cause Map.

The damage to the telescope occurred when the telescope was dragged across the ground.  It was dragged across the ground because the balloon did not get airborne, the gondola launched improperly (as best as we can tell from the video), and the gondola was carrying the telescope.  It’s likely that the high winds in the area impacted the ability of the balloon to get airborne.  It’s unclear why the gondola was improperly launched – more information on this should come out through the investigation.  The gondola was carrying the telescope so that it could be launched by balloon to complete its mission.  A reason given for using a balloon is that it is less expensive to build and launch than an orbiter.

As more information is released regarding this incident, we can add it to our Cause Map.  As NASA releases more details about what will be done to prevent future incidents of this kind, we can include these solutions

Oil Rig Explosion

By ThinkReliability Staff

On April 20, 2010 about 10 pm a huge explosion rocked a semi-submersible drilling oil rig about 40 miles off the coast of Louisiana in the Gulf of Mexico. The oil rig was called the Deepwater Horizon and was owned by Transocean Ltd and leased to the British Petroleum Company through September 2013.

The oil rig burned for about 36 hours before sinking.  126 people were on the oil rig at the time of the explosion.  Eleven are missing and presumed dead and 4 were critically injured. Oil continues to leak from the wellhead more than a mile underwater on the ocean floor at an estimated rate of 42,000 gallons a day.

Remotely operated submersible vehicles were used to examine the wellhead.  The vehicles were also used in an effort to manually trigger the blowout preventer, which would close the wellhead and prevent any farther release of oil.  The blowout preventer is a 450-ton valve installed at the wellhead that is designed to automatically shut to prevent oil leaks in the event of an accident.  Attempts to manually close the blowout preventer have not been successful.

The other containment options being explored are drilling a separate well nearby to plug the flow at a location below the blowout preventer and building underwater domes that would contain the oil until it could be safely pumped to the surface for disposal.  Both of these alternatives are being actively worked and will take months to complete.  It is estimated that 4.2 million gallons of oil will be released if the blowout preventer is not able to be closed.

The cause of the explosion is unknown at this time.  An investigation is underway by the Coast Guard and the Minerals Management Service.

A preliminary root cause analysis can be started using the information that is known and details can be added as they become available.  The analysis can be documented using a Cause Map which is a simple, intuitive format that visually lays out all known causes for an incident.  The first step in building a Cause Map is to determine how the organizational goals were impacted by the incident.  Causes for each impacted goal are determined to begin building the Cause Map.

In this case, the safety goal was impacted because 11 people were killed and several injured.  The environmental goal was impacted because there was a significant oil release.  The materials goal was impacted because the $700 million oil rig is a complete loss and the production/schedule goal was impacted because the oil drilling operation is shut down.

Click on the “Download PDF” button above to view an initial Cause Map.

The Future of NASA

By Kim Smiley

A previous blog discussed a shortfall in the National Aeronautics and Space Agency (NASA) budget.  The lack of funding put NASA’s organization goals in jeopardy, including a planned return mission to the moon.  Then-President George W. Bush had tasked NASA to return to the moon five years ago and NASA has been working toward this goal since.

President Obama announced his vision for NASA during a speech Kennedy Space Center on April 15.  He canceled plans for a moon mission and redirected NASA to focus on sending astronauts to an asteroid and work toward an eventual Mars landing.  The proposed budget would boost NASA funding by six billion over the next five years.

President Obama’s plan calls for private companies to fly to the space station using their own rockets and ships, freeing up NASA resources for basic research and development of technologies for trips beyond earth’s orbit.  The final space shuttle mission is scheduled for September 2011 after which the US will depend entirely on Russia to carry astronauts to the space station until a replacement for the space shuttle is developed.  Additionally, the space station’s life would be extended by five years as part of the Obama plan.

The planning necessary to achieve a goal of this complexity is mind boggling.   There are many new technical issues to consider and brand new equipment will need to be designed.  There are many, many potential problems that could arise during this design process and mission.

Cause Mapping is often used to perform a root cause analysis of an incident that has occurred, but it can also be used to proactively approach a problem by building a map that captures failures that could happen.  Identifying potential problems before they happen would allow NASA to mitigate risks and allocate resources efficiently.

Cause Maps could be built to any level of detail that was deemed appropriate.  Cause Maps could be developed to capture all potential failure modes for something as small as a single component or for something as large the entire mission.

Chinatown Fire NYC

By ThinkReliability Staff

On April 11, 2010, a fire broke out in a store on the first level of an apartment building on the 200 block of Grand Street in Chinatown, New York City. The fire would eventually reach 7 alarms, requiring 250 firefighters to fight. Once firefighters were able to enter the building the next day, they found one body.  33 people, including 29 firefighters, were injured and approximately 200 were left homeless, as the blaze left three buildings needing to be demolished and at least two more severely damaged.

For years the buildings affected (which were more than a century old) had been neglected, including violations for missing smoke detectors and a boiler which released smoke into the buildings.  At this point it’s unclear how these violations may have contributed to the fire and its aftermath.  At the time of the fire, the buildings were for sale for over $9 million, although no offers had been made.    There were many goals impacted by the fire, but the loss of human life and number of injuries are the focus for our investigation.

The injuries (many of which were smoke inhalation) were caused by a seven-alarm fire.  The fire was able to reach seven alarms because the fire was able to quickly spread through the six-story building.  In order for a fire to start heat, fuel and oxygen are required.  There’s no shortage of fuel and oxygen in an apartment building, due to necessities for people to live there.  The heat (or ignition source) may have been provided by exposed wiring that many residents have complained of, or the boiler previously cited for neglect.  Or, it may have been something else altogether.  (However, arson is not suspected at this point.)

The fire was able to spread so quickly due to a large number of voids and shafts in the building – a function of its  age.  Another cause that may have contributed to the death was a potential lack of warning of the fire due to the missing smoke detectors for which the building had also been previously cited.

Throughout an investigation there may be additional tools that help to clarify the incident.  Here we use a timeline to show the sequence of events.  A timeline is especially useful for complex events such as this.

A thorough root cause analysis built as a Cause Map can capture all of the causes in a simple, intuitive format that fits on one page.  In fact, the outline, Cause Map and timeline for this event easily fit on one page.  (View them by clicking “Download PDF” above.)   Even more detail can be added to this Cause Map as more information is released about the incident. As with any investigation the level of detail in the analysis is based on the impact of the incident on the organization’s overall goals.

Deadly Mine Explosion in West Virginia

By Kim Smiley

Around 3 pm on April 5, 2010 in Montcoal, West Virginia, a huge explosion rocked the Upper Big Branch South mine owned by Massey Energy Company.  At least 25 miners were killed, both from the explosion itself and suffocation caused by high levels of dangerous gases.

There are still 4 miners missing.  The missing miners were working farther back in the mine and the hope is that they were able to reach one of the airtight chambers stocked with enough food, water and oxygen for several days.  Rescue efforts are underway and drilling efforts are ongoing to add additional ventilation so that the gas levels can be reduced to safe levels to allow rescue workers to enter the mine.

This is the worst mine accident in the US in over 20 years. If the 4 missing miners are not found alive, this accident will have the highest number of fatalities since a 1970 mine killed 38 in Hyden, Kentucky.

What triggered this explosion is not known at this time, but both state and federal agencies have initiated investigations.

Even though many details are still unknown, a root cause analysis can be started by building an initial Cause Map.  There was an explosion which means there must have been an ignition source, flammable material and oxygen present.

The source of the flammable material is known since there were high methane gas levels in the mine.  Methane gas is naturally occurring in coal mines and must be continually vented.  It can also be assumed that the mine ventilation was inadequate for some reason since the gas levels built up.  Coal dust accumulation may have also contributed to the accident since powdered combustible material in an enclosed space is a very explosive combination.

The source of the spark that ignited the explosion is still unknown.

More information will become available as the investigation proceeds and a more detailed Cause Map can be built as additional causes are added.

Media reports about the accident have discussed past safety violations cited at the mine, but it won’t be clear if the accident was preventable until the investigation is completed.  What is known that in March 2010, the Mine Safety and Health Administration cited the Upper Big Branch mine for 53 safety violations.  In additional to the recent citations, there was also a troubling increasing trend in citations, which more than doubled between 2008 and 2009.

Hopefully, the information obtained during the investigation will provide useful lessons learned that can be implemented to prevent a similar accident in the future.

Oil Refinery Explosion Rocks Anacortes Washington

By ThinkReliability Staff

Early this morning (Friday, April 2nd, 2010), an explosion at an oil refinery rocked the town of Anacortes, Washington.  The cause of the explosion is not yet known.  However, even with very little information a root cause analysis of the event can be started.  It is extremely helpful to gather information regarding an incident as soon as possible after it occurs.  More information can always be added as the investigation continues.

In this case, the date and approximate time are known.  It’s not clear if there was anything different or unusual at the refinery this morning, so we’ll put a question mark here for now.  Detailed information regarding the exact location of the incident has been released, so we can record that the explosion occurred in an Anacortes, Washington oil refinery, at the catalytic reformer hydrotreater unit while maintenance work was being performed.

We also know that some of the company’s goals have been impacted.  One worker was killed, four workers were seriously injured, and three workers are missing.  These are all impacts to the safety goal.  Because of the severe impact to the safety goal and the loss of human life, the other goals are far less important.  However, we can record the impacts for assistance in performing the analysis.

Reports of black smoke in the area indicate pollution which is an impact to the environmental goal.  There are reports of some damage to nearby buildings, which could be considered an impact to the customer service goal.  The damage to the plant, and possible delay in production as a result, are impacts to the production/schedule and property goals.  Additionally, the emergency response is an impact to the labor goal.

The costs resulting from the impacts to the goals and the frequency of events such as these are not immediately known.  This is information that can be filled in as the root cause analysis continues.   As more information is released regarding the incident, we can continue our investigation.

Contaminated Drinking Water

By Kim Smiley

In 1922 the United Nations designated March 22 as World Water Day.  In honor of the occasion, a report titled “Sick Water” was published this week detailing issues with water pollution throughout the globe.

According to the report, two billion tons of pollution consisting of human and animal waste and industrial chemicals are dumped into waterways every day.  Almost 80 percent of sewage around the globe goes into waterways untreated.

Millions of people lack basic infrastructure including access to clean water, sanitation systems and water treatment facilities. The massive water pollution that results from this situation kills nearly 1.5 million children under age 5 every year.  Over half of the hospital beds in the world are occupied by people with illnesses caused by drinking contaminated water.

Even in developed nations, water pollution is a problem because many chemicals aren’t removed by the water treatments that kill the pathogens from sewage.  Chemicals from antidepressants, birth control, illegal drugs, sunscreen, and insect repellent are just some of the pollutants that have been found in US drinking supplies.

In addition to human illnesses caused by dirty water, water pollution has a large scale impact on the environment.  Over two billion tons of water is polluted daily, resulting in death of fish and choked coral reefs.

While the problem of water pollution isn’t a problem that is traditionally approached by root cause analysis, a Cause Map can be built to examine the causes of a wide range of issues.  Click on the “Download PDF” button to view a high level Cause Map of this issue.  The Cause Map could be expanded to incorporate as many causes as desired.

Power Outage Chile

By ThinkReliability Staff

A power outage struck Chile less than a month after an earthquake struck.  The power outage affected an area of nearly 2,000 kilometers and roughly 80% of Chile’s population.  Power in most areas was restored within several areas.  However, it was estimated that power to some in the Bio Bio region – which received more severe infrastructure damage – might be out for the better part of a week.

A power outage is an impact to the customer service and production/schedule goal.  The power outage was caused by the collapse of the Central Interconnected System (Sistema Interconectado Central).  The grid collapse was due to a lack of backup power capabilities, which was caused by a fragile power grid as a result of the earthquake, and interruption to the main power grid.  This interruption was caused by a disruption at the biggest substation due to a damaged transformer.  It’s unclear what caused the damage to the transformer, but it is believed to be related to the earthquake that hit in February.  We show this by adding a cause box with a question mark between “damaged transformer” and “earthquake on Feb. 27th”.

Repairs to the damaged transformer were required, which is an impact to the property and labor goals.

The Chilean government pledged to repair the transformer within 48 hours and stabilize the transmission lines within a week.  Interim solutions to get the electricity flowing were to isolate the damaged unit and install a reserve.  Additionally, Chileans have been asked to conserve electricity to minimize the amount of power transmitted through the lines.

By clicking ‘Download PDF” above, you can see the thorough root cause analysis built as a Cause Map that captures all of the currently known information in a simple, intuitive format that fits on one page.

Even more detail can be added to this Cause Map as the analysis continues. As with any investigation the level of detail in the analysis is based on the impact of the incident on the organization’s overall goals.