Attempted Bombing of Flight 253

By ThinkReliability Staff

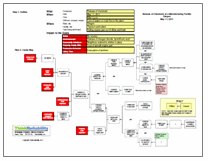
Despite constantly increasing airport security, a man suspected of terrorism was able to board a flight from Amsterdam to Detroit with ~80 grams of explosive and a liquid detonator. However, the device did not detonate, likely saving the plane.

Had the explosive detonated, it may have caused the loss of the plane, resulting in the deaths of all on the plane. Even though the loss of the lives and plane did not occur, the potential for it to happen is an impact to the safety goals.

The suspect was able to board the plane because despite warnings from his father, there was insufficient information to add him to the no-fly list (see process map) and his visa was not revoked.

Officials in the U.S. were unaware a visa had been issued by the U.S. embassy in London. Additionally, while the information from the suspect’s father was entered into TIDE (a terrorist intelligence database), there was no follow-up on the information. It’s unclear if there was no follow-up required, or if the follow-up was just not performed.

In an admitted failure of safety procedures, the explosives were not detected by airport security. The information about the suspect was considered not specific enough for the suspect to be put on the “selectee list” which would have led to additional screening. The suspect was not pased through a body scan, which may have detected the explosives, because they are not used on passengers traveling to the U.S. because of the privacy issues. The ingredients were hidden in the suspect’s undergarments and so were not detected by security.

Want to learn more? Read a more detailed root cause analysis of the attempted bombing.

International Space Station Supply Ship Crash

By ThinkReliability Staff

On August 24, 2011, a supply ship heading to the International Space Station (ISS) crashed in Siberia, losing two tons of cargo.  However, the impact of this loss was much more than the two tons of cargo – it may lead to an evacuation of the ISS, which would become unmanned for some unknown period of time.

The crash of the unmanned Progress 44 supply ship, which was on its way to resupply the ISS, was caused by the emergency deactivation of the Soyuz rocket when a gas generator malfunctioned.   Until the specific causes of the malfunction are determined, manned Soyuz flights are grounded.  That means that a new crew cannot get to the Space Station to relieve the current crew.  Although the current crew has enough supplies for the time being, they cannot remain on the space station past December.  The spacecraft already at the station (their “guaranteed ride home”) are only allowed in space for 200 days – due to limited battery life and concern for degradation of rubberized seals from contact with thruster fuel.

Because of a lack of funding, American shuttles are now all mothballed, leaving the Russian Soyuz rockets the  only way to and from the space station.  Finding another way to get there by December is unlikely, leaving the attempt to determine and fix the problems with Soyuz the only hope for continued manning of the ISS.

We can examine this incident in a Cause Map, beginning with the impacts to the goals.  For example, although there were no safety goal impacts resulting from the crash of the unmanned ship, the customer service goal is impacted due to the potential of evacuating the ISS.  The production goal is impacted because of the grounding of manned Soyuz flights, and the property goal is impacted due to the two tons of lost cargo meant for the space station.  We begin our Cause Map with these impacts to the goals, asking “Why” questions to complete the analysis.  The amount of detail in the map is determined by the impact to the goals.  Because the crash may lead to the evacuation and continued unmanned operation of the space shuttle, once specific causes are determined, this Cause Map would become quite detailed.  For now, because the causes have not yet been determined, we begin with a simple map, which does capture the impacts to the goals and the basic information now known.

To view the Outline and Cause Map, please click “Download PDF” above.

Spill Kills Hundreds of Thousands of Marine Animals

By ThinkReliability Staff

A recent fish kill is estimated to have killed hundreds of thousands of marine life – fish, mollusks, and even endangered turtles – and the company responsible is facing lawsuits from nearby residents and businesses affected by the spill causing the kill.  A paper mill experienced problems with its wastewater treatment facility (the problems have not been described in the media), resulting in the untreated waste, known as “black liquor”, being dumped in the river.  The waste has been described as being “biological” not chemical in nature; however, the waste reduced the oxygen levels in the river which resulted in the kill.

Although it’s likely that a spill of any duration would have resulted in some marine life deaths, the large number of deaths in this case are related to the length of time of the spill.  It has been reported that the spill went on for four days before action was taken, or the state was notified.  The company involved says that action, and reporting to the state, are based on test results which take several days.

Obviously, something needs to be changed so that the company involved is able to determine that a spill is occurring before four days have passed.  However, whatever actions will be taken are as of yet unclear.  The plant will not be allowed to reopen until it meets certain conditions meant to protect the river.  Presumably one of those conditions will be figuring out a method to more quickly discover, mitigate, and report problems with the wastewater treatment facility.

In the meantime, the state has increased discharge from a nearby reservoir, which is raising the water levels in the river and improving the oxygen levels.  The company is assisting in the cleanup, which has involved removing lots of stinky dead fish from the river.  The cleanup will continue, and the river will be stocked with fish, to attempt to return the area to its conditions prior to the spill.

This incident can be recorded in a Cause Map, or a visual root cause analysis.  Basic information about the incident, as well as the impact to the organization’s goals, are captured in a Problem Outline.  The impacts to the goals (such as the environment goal was impacted due to the large numbers of marine life killed) are used to begin the Cause Map.  Then, by asking “Why” questions, causes can be added to the right.  As with any incident, the level of detail is dependent on the impact to the goals.

To view the Outline and Cause Map, click “Download PDF” above.

Release of Chemicals at a Manufacturing Facility

By ThinkReliability Staff

A recent issue at a parts plant in Oregon caused a release of hazardous chemicals which resulted in evacuation of the workers and in-home sheltering for neighbors of the plant.  Thanks to these precautions, nobody was injured.  However, attempts to stop the leak lasted for more than a day.  There were many contributors to the incident, which can be considered in a root cause analysis presented as a Cause Map.

To begin a Cause Map, first fill out the outline, containing basic information on the event and impacts to the goals.  Filling out the impacts to the goals is important not only because it provides a basis for the Cause Map, but because goals may have been impacted that are not immediately obvious.  For example, in this case a part was lost.

Once the outline is completed, the analysis (Cause Map) can begin.  Start with the impacts to the goals and ask why questions to complete the Cause Map.  For example, workers were evacuated because of the release of nitrogen dioxide and hydrofluoric acid.  The release occurred because the scrubber system was non-functional and a reaction was occurring that was producing nitrogen dioxide.  The scrubber system had been tripped due to a loss of power at the plant, believed to have been related to switch maintenance previously performed across the street.Normally, the switch could be reset, but the switch was located in a contaminated area that could only be accessed by an electrician – and there were no electricians who were certified to use the necessary protective gear.  The reaction that was producing the nitrogen oxide was caused when a titanium part was dipped into a dilute acid bath as part of the manufacturing process.

When the responders realized they could not reset the scrubber system switch, they decided to lift the part out of the acid bath, removing the reaction that was causing the bulk of the chemicals in the release.  However, the hoist switch was tripped by the same issue that tripped the scrubber system.  Although the switch was accessible, when it was flipped by firefighters, it didn’t reset the hoist, leaving the part in the acid bath, until it completely dissolved.

Although we’ve captured a lot of information in this Cause Map, subsequent investigations into the incident and the response raised some more issues that could be addressed in a one page Cause Map.  The detail provided on a Cause Map should be commensurate with the impacts to the goals.  In this case, although there were no injuries, because of the serious impact on the company’s production goals, as well as the impact to the neighboring community, all avenues for improvement should be explored.

To view the Outline and Cause Map, please click “Download PDF” above.  Or click here to read more.

Rioting in England

By ThinkReliability Staff

Rioting is a defined as a violent, public disorder caused by a group of persons.  It is a unique phenomenon in that it is difficult to pinpoint exactly what is going to trigger and sustain a riot.  Social scientists know that there is a tipping point at which participants no longer fear punishment (such as jail) as the number of gatherers increases.  However there are many common contributing factors.  A Cause Map can help sort out what led to this month’s rioting over in the United Kingdom.

It began on August 4th, following the police shooting of a 29-year old in North London.  The police claimed he was suspected of weapons possession and were attempting to execute a warrant.  During the arrest, the suspect was shot and killed.  However, questions arose regarding the circumstances of the arrest and family and friends came to believe that the victim, Mark Duggan, was unarmed.  This led to a peaceful protest of approximately 120, ending at the police station in Tottenham, North London.  Protestors demanded answers, and police officials seemed unable to satisfy the crowd.

The crowd lingered while police stalled, and grew as disgruntled local youths began to arrive at dusk.  At this point, things began to spiral out of control.  Why did this unsatisfied, but otherwise quiet gathering turn into a multi-day riot across an entire country?

According to social scientists, rioting generally occurs when there are certain elements present.  Normally there have to be a lot of people.  There also needs to be a low level of perceived risk that they will be punished for unacceptable behavior.  This perception generally increases as there are fewer law enforcement officers and also as there are more people.  Those people generally are upset about something.  There also needs to be a feeling that others are likely to join in.  But even with all these elements, a riot will not start.  The final element is a “catalyst”.  This is typically a person who has calculated that the risk of being targeted by law enforcement is sufficiently low, and acts out – such a throwing a rock through a window.

Examining the Cause Map reveals that these elements were present in the initial riot as well as in the general rioting that broke out across the country.  It becomes evident that the rioting was cyclical – the initial riot led to more widespread rioting.  And the same elements that were present in the initial riot were present in the widespread rioting as well.

After completing the Cause Map analysis, the next step is to determine how to prevent this from happening again.  Everyone seems to have an opinion on what went wrong, and more importantly what needs to be done differently to prevent such costly and dangerous behavior.  Resorting back to the Cause Map, we can look for opportunities to prevent future riots.  Some of the elements that contribute to a riot can be controlled more easily than others.  For instance it is easier to limit mass gatherings than control the emotions of a crowd.  Hence, greater police presence and an ability to clear the street – through curfew or quick arrests – are usually the best solutions for limiting riots.  A table of proposed solutions completes the analysis.

Greece Economic Woes – Part 2

By ThinkReliability Staff

In our previous blog about Greece’s economic woes, we looked at some of the impacts the recent events have had on Greece and potentially the rest of the European Union (EU) and a timeline of the events that are part of the ongoing economic crisis.  However, we stopped short of an analysis of what contributed to these impacts.

The outline, which we filled out previously, discusses an event or incident with respect to impacts to the goals of a country (economy, company, etc.).  An analysis of the causes of these impacts can be made using a Cause Map, or visual root cause analysis.  To do so, begin with one impacted goal and ask “why” questions to complete the analysis.  For example, Greece’s financial goal is impacted because its debt rating is just above default.  Why? Because the ratings agencies were concerned with Greece’s ability to repay.  Why? Because their debt to revenue ratio is too high.

Whenever you encounter a situation where a ratio is too high – such as this case, where debt is too high compared to revenue – it means that the Cause Map will have two branches.  Each part of the ratio is a branch.  In this case, if debt to revenue is too high, it means that debt is too high and revenue is too low.  Each branch can be explored in turn.  There have been cases made that only one or the other branch is important, but what we’re looking for in a Cause Map is solutions that can help ameliorate the problem.   Due to the severity of the issue in Greece, solutions that reduce debt and solutions that increase revenue must both be implemented in order to attempt to repair the financial standing.

Greece’s government debt is high – caused by government spending on borrowed money when the euro was strong and interest rates were low.  There are many parts to government spending, which can make their own Cause Map.  Suffice to say, reducing government spending – by a lot – is necessary to reduce the debt to revenue ratio.  Unfortunately, severe reductions in government spending also mean reductions in government services, and government salaries.  As an example, government workers, which total 25% of the total workforce, are seeing their pay reduced 10%.  As you can imagine, this reduced spending has angered some Greeks, causing riots, which have killed Greek citizens.  In this case, the solution “reduced spending” also becomes a cause in another branch of the Cause Map.  It’s important to remember that not all solutions are free of consequences and that solutions themselves may contribute to the overall problems.

Greece’s revenue is insufficient to fuel their current spending levels.   Tax revenue is decreased by tax evasion, high unemployment, and a shrinking economy.  The Cause Map isn’t simple here either, because the shrinking economy contributes to the unemployment rate, and decreased spending can result in decreased revenue.  The worldwide economic woes are contributing to the shrinking economy, but also low levels of foreign investment, caused by what is considered a difficult place to do business due to political, legal, and cultural issues.  Last but not least, many governments in Greece’s situation would devalue their currency in order to regain an economic edge.  However, Greece uses the Euro – so devaluing currency isn’t an option.  There has been some talk of Greece dropping the Euro but a bailout by the other EU countries (itself an impact to the goals) appears to have shelved that discussion for now.

In addition to reduced tax revenue, Greece is having trouble borrowing money.  As their credit rating has fallen (it now has the lowest credit rating in the world), interest rates for loans are climbing, so it is possible that Greece will still fall into bankruptcy and loans will not be repaid. This is caused by the debt to revenue ratio, and adds a circular reference to our map.  This is why the economic issue has been described as a spiral – the causes feed into each other, making it difficult to climb out.

However, Greece has made admirable strides to attempt to reduce their debt and increase their revenue.  Only time will tell if that, and the bailout from the EU, will be enough.

Train Crash in China Kills 39

By Kim Smiley

It is rare for the conduct of the investigation to be one of the biggest headlines in the week following an accident, but this has been the case after a recent train crash in China.  On July 23, 2011, two trains collided in Wenzhou, China, killing 39 and sending another 192 people to the hospital.

What appears to have happened is that a train moving at speed rear ended another train that had stalled on the tracks. It was announced that the first train had stalled after a lightning strike.  Soon after the accident, people reported seeing the damaged train cars broken apart by back hoes and buried.  Meaning the evidence was literally being buried without ever having been thoroughly examined.  The Chinese government stated that the cars contained “State-level” technology and were being buried to keep it safe.

The internet frenzy and public outrage fueled by how this investigation was handled was impressive. According to a recent New York Times article, 26 million messages about the tragedy have been posted on China’s popular twitter-like microblogs.  So powerful has the public outrage been that the first car from the oncoming train has been dug up and sent to Wenzhou for analysis.

More information  on the technical reasons for the train crash is slowly coming to light.  Five days after the accident, government officials have stated that a signal which would have stopped the moving train failed to turn red and the error wasn’t noticed by workers.  There is talk about system design errors and inadequate training.

It’s unlikely that all the details will ever be public knowledge, but there is one takeaway from this accident that can be applied to any organization in any industry that performs investigations – the importance of transparency. The Chinese government spent over $100 billion in 2010 expanding the high speed rail system, but if people don’t feel safe riding the rail system it won’t be money well spent.  Customers need to feel that an adequate investigation has been performed following an accident or they won’t use the products produced by the company.

To view an initial Cause Map built for this train accident, please click on “Download PDF” above.  A Cause Map is an intuitive, visual method of performing a root cause analysis.  One of the benefits of a Cause Map is that it’s easily understood and can help improve the transparency of an investigation for all involved.

Greece Economic Woes – Part 1

By ThinkReliability Staff

Greece is currently suffering from an economic crisis.  Leaders in Greece, the European Union, and the rest of the world are all anxiously watching as events unfold to attempt to minimize the impact of these issues.  An analysis of this issue can help these leaders minimize their own impacts, as well as provide appropriate aid to Greece.  However, performing an root cause analysis on an issue whose roots reach back years is not an easy task.

Normally a root cause analysis performed as a Cause Map begins with a problem outline.  However, sometimes an issue is so complicated that it’s difficult to begin there.  In these kinds of cases, beginning with the creation of a timeline may aid in the investigation.

What to include in the timeline is a frequently asked question.  When beginning a timeline, put in all the information you have.  It may make sense to go back later and create a less detailed timeline.  However, many events that don’t initially seem to add much to the timeline may later turn out to be important in the analysis.  In the case of Greece, I began the timeline with Greece’s entry into the European Union (EU).  While it wasn’t clear initially whether this contributed to the current issues being faced by Greece, it later became clear that the restrictions placed on EU-member countries did in fact contribute to the current issues.

Events in the timeline may turn out to be impacted goals.  For example, at various points in the timeline Greece’s credit rating has been downgraded.  The last downgrade occurred just before default by Moody’s.  Having a solid credit rating is an important goal – so a downgraded credit rating, especially one as low as Greece’s, is an impact to the financial goal of that country.

Once the timeline has begun (it’s not really complete until the issue is considered resolved, which in this case will take years), the next step would be to tackle the outline.  Writing the timeline will hopefully have provided some clarity to the issue.  For example, since Greece entered recession in 2009, we can choose 2009-2011 as a logical time to enter in the outline.  If more detail is desired, referring to the timeline is also appropriate.

The most commonly asked question about the outline is what to write in the “differences” row.  Differences are meant to capture things that may have been out of the ordinary, or potentially answer the question “why this country (or equipment or time) as opposed to some other country?”  Because Greece is a part of the European Union, which has consistent financial goals for its members, we can use some data points that show how Greece differs from other countries in the EU, or essentially answer the question “why is Greece having these issues instead of the other EU countries?”  In Greece, debt is estimated to be 150% of the Gross Domestic Product (GDP).  This is much higher than for most other nations.  The public sector in Greece accounts for about 40% of the GDP, also higher than typical.  Greece has the second lowest Index of Economic Freedom in the EU, which impacts its ability to quickly adjust to economic changes.   Greece economic statistics were (significantly)   misreported, contributing to the rapid decline in stability.  And, Greek tax evasion is estimated at 13B Euros a year.  This is likely not a full list of the differences between Greece and other EU countries, but it’s a start  and the outline can continue to evolve as more information is provided on the issue.

Once the top portion of the outline is complete, the impacts to the goals can be addressed.  Again, many of these impacts can be pulled from the timeline.  There were some citizen deaths associated with rioting as a result of proposed economic policies, which is an impact to the safety goal.  Spending cuts and tax increases impact the customer service goal (in this case, the “customers” are the citizens of Greece).  The production goal is impacted because of high (above 16%) unemployment, and the financial goals are impacted by a debt rating just above default and a 110B euro default.  Last but not least, there is the potential for impact on the European Union if the crisis spreads beyond Greece.

As you’ve noticed, no real analysis has yet taken place.  We’ll look at some of the causes contributing to the      current issues in Greece in an upcoming blog.  Click on “Download PDF” above to view the timeline and outline

Foreclosures Down?

By ThinkReliability Staff

At first glance, it might appear to be a welcome story.  After years of decline in the housing market, there has been a significant dip in foreclosure filing rates.  However the real reason behind the dip isn’t economic recovery…it’s a backlog of work at banks across the nation.  A visual Cause Map helps illuminate what is really going on.

Foreclosure filings have dropped 25% in the last six months of 2010.  This normally would mean that fewer properties require foreclosure.  Banks usually notify homeowners within days of the first missed payment.  After multiple missed payments, the Notice of Default is finally sent to the homeowner, about 2 months after the initial missed payment. If the homeowner doesn’t pay up, that’s followed soon after by a foreclosure filing.  In most states, eviction can happen in as little as 120 days.

However in today’s economy, banks are slower to take on new foreclosures.  One of the major causes – a huge backlog of vacant properties – has made banks reluctant to notify newly delinquent homeowners.  The initial notification process has slowed down, but so has the entire foreclosure process.  Banks hope that by delaying the process, homeowners may be able to resume payment – the preferred outcome.  In some states, foreclosures are averaging well over 900 days.  Banks are in the business of managing money, not property.

There’s another reason behind the processing delays.  Last fall banks were brought to court for robo-signing, a practice where law firms were automatically signing off on all foreclosure paperwork.  The practice meant that many applicants were illegally kicked out of their homes.  Many of the largest banks and lenders suspended processing to determine how robo-signing was occurring and stop it.  It turns out that law firms, in an effort to get through the mountains of paperwork, were rubberstamping the foreclosure filings without due diligence to ensure everything was in order.

Delayed foreclosures are beneficial to families facing eviction, however often it is simply delaying the inevitable.  Many economists believe that the economy will continue to struggle until the housing market recovers.  In the meantime, the foreclosure crisis will drag on until banks can close out these dysfunctional loans.

City Facing Default

By ThinkReliaiblity Staff

A small Rhode Island town is on the brink of financial disaster.  A low tax basis and mounting liabilities are leaving Central Falls with few options short of filing for bankruptcy protection.   The town has requested financial assistance from state and federal governments and is begging pensioners to accept lower benefits.  But how did they get to this point, and what can be done to keep neighboring towns – and the state itself – from bankruptcy?  A Cause Map visually shows how this occurred.

Like other towns facing financial difficulty, Central Falls accepted more debt than they are now able to pay.  This two-fold reason is at the center of the Cause Map.  All of the effects Central Falls now faces – such as closed town services and the loss of local jobs – stem from the fact that the city had to cut spending.  The city had to cut spending because it is facing bankruptcy.  The Cause Map method allows us to trace the reasons back even further and build a complete picture.

The first piece is that the town has a large debt – $80M to be exact – in pension liabilities for its 214 city police officers and fire fighters; this is in addition to $25M in budget deficits over the next five years.  The generous pensions can be traced back to two state laws regarding public worker negotiations.  Rhode Island is one of the few states that allows workers unlimited collective bargaining, meaning that workers can negotiate for a higher salary for any reason.  Without any limits, talks often broke down.  When talks broke down arbitrators stepped in, and their decisions were binding.  In past years, arbitrators often settled on benefits that were comparable to surrounding towns instead of what the city could actually afford.  Unlimited collective bargaining and binding arbitration together contributed to the poor negotiations and overly-generous benefits.

The second piece is that the town doesn’t have a large income.  It has a small tax basis since the median family income is only around $33,000.  Other sources of income have been pulled back as well – like state and federal funding.  The state is facing similar issues, and is in no place to bail out the multiple municipalities at risk.  The federal government had extended aid, but rescinding it when Central Fall’s credit rating was downgraded by Moody’s.

Municipal bankruptcy is a rare occurrence, with fewer than 50 occurring in the last 3 decades nationwide.  State bankruptcy is practically unheard of.  Arkansas was the last to default on its bonds, following the Great Depression.  This is in part to bankruptcy laws put in place after to avoid such an occurrence.  When one town goes bankrupt, neighboring communities are often negatively affected.  The resulting domino effect could be disastrous.  Rhode Island is a small state with little room to maneuver if local towns – like Central Falls – start going bankrupt.