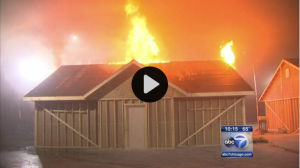
All posts by Kim Smiley

Mechanical engineer, consultant and blogger for ThinkReliability, obsessive reader and big believer in lifelong learning

Investigators Blame “Human Error” for Train Collision

By Kim Smiley

On February 9, 2016, two commuter trains collided head-on in Upper Bavaria, Germany.  Eleven people were killed and dozens were injured.  Investigators are still working to determine exactly what caused the accident and the train dispatcher is currently under investigation for involuntary manslaughter and could face up to five years in prison if convicted.

Although the investigation is still ongoing, some information has been released about what caused the crash.  The two trains collided head-on because they were both traveling on the same track toward each other in opposite directions.  Running two trains on the same track is common practice in rural regions in Germany and these two trains were scheduled to pass each other at a station with a divided track. The drivers of both trains were unaware of the other train.  The accident occurred on a bend in a wooded area so the drivers could not see the other train until it was too late to prevent the collision.

The dispatcher failed to prevent a situation where two trains were running towards each other on the same track or to inform the drivers about the potential for a collision.  Investigators have stated that the dispatcher sent an incorrect signal to one of the trains due to “human error”.  After realizing the mistake – and that a collision was imminent – the dispatcher issued emergency signals to the trains, but they were too late to prevent the accident.

All rail routes in Germany have automatic braking systems that are intended to stop a train before a collision can occur, but initial reports are that the safety system had been manually turned off by the dispatcher.  German media has reported that the system was overridden to allow the eastbound train to pass because it was running late, but this information has not been confirmed.  Black boxes from both trains have been collected and analyzed.  Technical failure of the trains and signaling equipment have been ruled out as potential causes of the accident.

The information that has been released to the media can be used to build an initial Cause Map, a visual root cause analysis, of this issue.  A Cause Map visually lays out the cause-and-effect relationships and aids in understanding the many causes that contributed to an issue. The Cause Map is built by asking “why” questions. A detailed Cause Map can aid in the development of more effective solutions.

One of the general Cause Mapping rules of thumb is that an investigation should not stop at “human error”.  Human error is too general and vague to be helpful in developing effective solutions. It is important to ask “why” the error was made and really work to understand what factors lead to the mistake.  Should the safety system be able to be manually overridden?  Is the training for dispatchers adequate?  Does there need to be a second check on decisions by dispatchers?  Should two trains traveling in opposite directions be sharing tracks?  I don’t know the answers, but these questions should be asked during the investigation.  Charging the dispatcher with involuntary manslaughter may prevent HIM from making the same mistake again, but it won’t necessarily reduce the risk of a similar accident occurring again in the future.  To really reduce risk, investigators need to dig into the details of why the error was made.

Failure of the Nipigon River Bridge

By Kim Smiley

On the afternoon of January 10, 2016, the deck of the Nipigon River Bridge in Ontario unexpectedly shifted up about 2 feet, closing the bridge to all vehicle traffic for about a day.  After an inspection by government officials and the addition of 100 large cement blocks to lower the bridge deck, one lane was reopened to traffic, with the exception of oversized trucks. Heavier trucks are required to detour around the bridge with the main alternative route requiring crossing into the United States.  This failure is still being investigated and it isn’t known yet when it will be safe to open all lanes on the bridge.

More information is needed to understand all the details that led to this failure, but an initial Cause Map, a visual root cause analysis, can be built to illustrate what is currently known. The first step in the Cause Mapping process is to fill in the Outline to document the basic background information (the what, when and where) and the impacts to the organization’s goals resulting from the issue.  For this example, the bridge was damaged and significant resources will be needed to investigate the failure and repair the bridge.  The closure of the bridge, and subsequently having only a single open lane, is also having a sizable impact on transportation of both people and goods in the area.  It is estimated that about $100 million worth of goods are moved over the bridge daily and there are limited alternative routes.

Once the Outline is completed, the Cause Map is built by asking “why” questions and visually laying out the cause-and-effect relationships.  Why did the deck of the bridge shift up?  Investigators still don’t have the whole answer. The Nipigon River Bridge is a cable stayed bridge and bolts holding the bridge cables failed, resulting in the deck of the bridge being pulled up at an expansion joint.  Two independent testing facilities, National Research Council of Canada in Ottawa and Surface Science Western at Western University, are conducting tests to determine the cause of the bolt failures, but no information has been released at this time.

The Nipigon River Bridge is a new bridge that has only been open since November 29, 2015. Some hard questions about the adequacy of the bridge design have been asked because the failure occurred so soon after construction.  Officials have stated that the bridge design meets all applicable standards, but investigators will review the design and structure during the investigation to ensure it is safe.  Ontario winters can be harsh and investigators are going to look into whether cold temperatures and/or wind played a role in the failure.  Eyewitnesses have reported a large gust of wind just prior to the bolt failure.  Investigators will determine what role the wind played.

The Cause Map can easily be expanded to incorporate new information as it becomes available. Once the Cause Map is completed, the final step in the Cause Mapping process is to develop solutions to prevent a similar problem from recurring.  In this example, adding the concrete blocks as counter weights allowed one lane of the bridge to be opened in the short term, but clearly a longer-term solution will be needed to repair the bridge and ensure a similar failure does not occur again.

Facebook Bug Makes Users Feel Old

By ThinkReliability Staff

In a real blow for an industry constantly trying to remain hip and relevant, many Facebook users were notified of “46 year anniversaries” of their relationships with friends on Facebook on the last day of 2015. Facebook (which is itself only 11 years old) issued a statement saying “We’ve identified this bug and the team’s fixing it now so everyone can ring in 2016 feeling young again.”

While Facebook didn’t release any details about what caused the bug, a pretty convincing explanation was posted by Microsoft engineer Mark Davis. We can his theory to create an initial Cause Map, or visual root cause analysis. The first step in the Cause Mapping process is to fill out a problem outline. The problem outline captures the what (Facebook glitch), when (December 31, 2015), where (Facebook) and the impact to the organization’s goals. In this case, the only goals that appear to be impacted are the customer service goal (resulting from the negative publicity to Facebook) and the labor/time goal (which resulted from the time required to fix the glitch).

The next step in the Cause Mapping process is the analysis. The Cause Map begins with an impacted goal. Asking “Why” questions develops the cause-and-effect relationship that resulted in the effect. In this case, the impact to the customer service goal results from the negative publicity. Continuing to ask “Why” questions will add more detail to the Cause Map. The negative publicity was caused by Facebook posting incorrect anniversaries.

Some effects will result from more than one cause. Facebook posting incorrect anniversaries can be considered an effect that was caused by incorrect anniversary dates being identified by Facebook AND Facebook posting anniversary dates. Because both of these causes were required to produce an effect, they are joined with an “AND” on the Cause Map. (If the anniversary dates had been identified correctly, or if they weren’t posted on Facebook, the issue would not have occurred.) The incorrect anniversary dates were due to a software glitch (or bug), according to Facebook. Inadequate testing can generally be considered a cause whenever any bug is found in software that is used or released to the public. Had a larger range of dates been used to test this feature, the software glitch would have been identified before it resulted in public postings on Facebook.

Other impacted goals are added to the Cause Map as effects of the appropriate goals. In this case, the labor/ time goal is impacted because of the time needed to fix the glitch. The cause of this is the software glitch. All impacted goals should be added to the Cause Map.

The cause of the software bug is not definitively known. To indicate potential causes, we include a “?” after the cause, and include as much evidence as possible to support the cause. Testimony can be used as evidence for causes. In this case, the source of the potential causes is a Microsoft engineer, who described a potential scenario that could lead to this issue on Facebook. Unix, which is an operating system, associates the value of “0” with the date of 1/1/1970 (known as the Unix epoch). If the date a user friended another user was entered as “0” and the system identified friending dates for all friends, the system would identify friending dates as 1/1/970, and with some accounting for time zones, would see 46 years of friendship on December 31, 2015. It is presumed that the friend date would be entered as “0” if a friendship already existed prior to Facebook tracking anniversaries.

Errors associated with the Unix epoch are pretty common, but this appears to be the first time a bug like this has bitten Facebook. Presumably the error was quickly fixed, but we won’t know for sure until next December.

The year Christmas almost wasn’t

By Kim Smiley

The movie Elf, starring Will Ferrell as Buddy the elf, tells the story of a Christmas that nearly disappointed children worldwide.  On Christmas Eve night, as Santa made his magical trip to deliver his bag of Christmas gifts, his sleigh crashed in Central Park in New York City.  Only quick thinking by Buddy and his friends got Santa airborne again and saved the holiday.

A Cause Map, a visual root cause analysis, can be built to analyze the crash of Santa’s sleigh.  A Cause Map is built by visually laying out all the cause-and-effect relationships that contributed to the issue.  The first step in the Cause Mapping process is to fill in an outline with the basic background information as well as impacts to the goal.  Nearly every problem impacts more than one goal and listing all the impacts helps fully understand the scope of the issue.

In this example, there is potential risk of damage to the sleigh and injury to the big guy himself which would be an impact to the equipment goal and safety goal respectively.  There was a delay in the present delivery schedule while Santa’s sleigh was on the ground, but the biggest concern was the impact to the customer service goal because millions of children had the potential to wake up to a Christmas morning without gifts, certainly something Santa and his elves desperately wanted to avoid.   Once the Outline is completed, the Cause Map itself is built by starting at one impacted goal and asking “why” questions.

So why did Santa’s sleigh crash into Central Park?  Santa’s sleigh crashed because it was high above the ground and it lost propulsion.  Flying is the sleigh’s typical mode of operation because Santa needs a speedy, magical mode of transportation to do his job.  The sleigh lost propulsion because both the primary and secondary propulsion systems failed.

Originally, Santa’s sleigh was powered purely by Christmas cheer, but levels of Christmas cheer have been steadily declining in modern times and a secondary system, a Kringle 3000, 500 Reindeer-Power jet engine, had to be added in the 1960s to keep the sleigh flying.  On the Christmas in question, the level of Christmas cheer hit an all-time low and the strain on the jet engine mount was too great and it broke off.  Without the jet engine, Santa’s sleigh crashed. Luckily, Buddy had told his friends that “the best way to spread Christmas cheer is singing loud for all to hear” and they were able to inspire enough folks to sing along with carols that Santa’s sleigh flew back into action and the children got their presents.

One would hope that the design of the jet engine was improved after this accident, but just to be safe and ensure that there are no sleigh crashes this year, make sure you sing plenty of Christmas carols loudly for all your friends and families to hear!  And if you are concerned about Santa’s progress and want assurances that all is well, you can monitor his progress around the world at the NORAD Santa tracker.

Why New Homes Burn Faster

By Kim Smiley

Screen Shot 2015-12-04 at 11.50.42 AMResearch has shown that new homes burn up to eight times faster than older homes.  What this means is that people have less time to get out of a house when a fire starts – a lot less time.  People living in older homes with traditional furnishings were estimated to have about 17 minutes to safely evacuate a home, but the time decreases to about three minutes in a home built with modern materials and furnished with newer, synthetic furniture.

Modern manufactured wood building materials have a lot of advantages. They are lighter, stronger and cheaper than using traditional wood materials, but these characteristics also mean they burn a lot faster.  Additionally, modern homes typically contain more potential fuel for fires. Many modern furnishings are manufactured using synthetics that contain hydrocarbons, which are a flammable petroleum product.  Furnishings manufactured with synthetic products will burn faster and hotter than traditional furnishings built using wood, cotton and down.  Most modern homes also just simply have more stuff in them that is potential fuel.

Other factors can also make modern homes more dangerous when a fire occurs. Many modern homes are open concept designs as opposed to more compartmentalized traditional designs.  Open spaces in a home can provide more oxygen for a fire to quickly grow.  Additionally, modern energy-efficient windows can help trap heat in a home when a fire starts and can lead to a fire spreading more rapidly. Changes in the way we live and build homes and furnishings have all contributed to modern homes building significantly faster, a potential danger that people need to be aware of so that they can work to keep themselves and their children safe.

The best way to protect yourself and your family is to prevent a fire from occurring in the first place.  Never leave candles burning unattended. Keep all potentially flammable items away from fireplaces and heaters. Don’t leave things on the stove unattended. During the holidays, make sure to keep Christmas trees well watered and away from heat sources and ensure candles are a safe distance from any potentially flammable objects.   These and other basic common sense steps really do prevent fires from occurring.

Of course there is no way to guarantee that a fire will never occur so every house needs working smoke detectors.  It is recommended that they are checked monthly to verify they are functional and that the batteries are changed regularly.  Most fatalities associated with home fires are in homes without working smoke detectors so it really is worth the time and effort to ensure they are kept in good working order.

To view a Cause Map, a visual root cause analysis of this issue, click on “Download PDF” above.


Neurotoxin makes California crabs unsafe to eat

By Kim Smiley

California officials have delayed indefinitely both recreational and commercial fishing for Dungeness and Rock crab from the coast north of Santa Barbara all the way to the Oregon border because the crabs have been determined to be a threat to public safety.  Testing has shown that many of the crabs in this region contain potentially unsafe levels of domoic acid, a powerful neurotoxin, that can cause illness in humans if they consume the crabs. Domoic acid poisoning causes vomiting, diarrhea, cramping and can even lead to brain damage and death in severe cases.  Scientists are continuing to test crabs caught off the California coast and the hope is to open crabbing season if/when the crabs are found to be safe for consumption.

A Cause Map, a visual root cause analysis, can be built to help understand the causes that contribute to this issue.  The first step in building a Cause Map is to understand the impacts from the issue being considered.  Obviously this issue has the potential to impact public safety because the crabs have the potential to cause illness, although no cases of domoic acid poisoning in humans have been reported in this year. The economic impact to the fishing industry from the delay in the start of crabbing season is also very significant.  California’s crabbers typically gross about $60 million a year and many families depend on the money made during crab season to live on throughout the year.  This issue also impacts the environment because humans aren’t the only animals that can suffer from domoic acid poisoning and other creatures are continuing to eat the contaminated crabs.  Sea lions in particular have been affected by the neurotoxin and many have died.  Removing large predators has the potential to significantly impact the entire ecosystem.

The Cause Map itself is built by asking “why” questions and laying out the answers to intuitively show the cause-and-effect relationships. So why do the crabs have high levels of domoic acid in their bodies?  This year off the coast of California, warmer than typical ocean temperatures have led to an unusually large and long-lasting algae bloom created by Pseudo-nitzschia. Domoic acid is naturally produced by Pseudo-nitzschia and it can be concentrated into dangerous levels as it moves up the food chain.  Small fish and shellfish such as krill, anchovies and sardines consume the domoic acid along with the algae.  Crabs eat the smaller creatures that have been contaminated with domoic acid.  Crabs can eventually excrete the domoic acid, but the process is slow and takes enough time that the domoic acid can build up to high levels in the bodies of the crabs.  If bigger creatures such as humans and sea lions eat the contaminated crabs, they can be poisoned by the domoic acid that was initially produced by the algal bloom.  There is nothing that can make the contaminated crabs safe for consumption. Neither cooking nor cleaning can eliminate the risk of poisoning from the neurotoxin so the only safe option is to wait until the domoic acid returns to safe levels in the crabs.

To view an Outline that lists the impacted goals and see a high level Cause Map of this issue, click on “Download PDF” above.

High School Open Flame Chemistry Demonstration Ends in Injuries

By Kim Smiley

Six were injured, two seriously, in an accident involving an open flame chemistry demonstration at a high school in Fairfax County, Virginia on October 31, 2015.  At the time of the incident, the teacher was performing a well-known experiment to show the students how different chemical elements can change the color of a flame. According to students present in the classroom, the teacher was in the process of adding more flammable liquid to the experiment when a splash of fire hit students and the teacher.

A Cause Map, or visual root cause analysis, can be used to analyze this incident.  The first step in the Cause Mapping process is to fill in an outline to document all the basic background information for an incident such as time, date, and location.  Additionally, how the incident impacts the organization’s goals is listed on the bottom of the outline.  For this example, the safety goal is clearly impacted by the injuries, but there are several other impacts that need to be considered as well such as the damage to the classroom, evacuation of the school and required emergency response.  Fairfax County has also banned all open flame experiments pending a thorough investigation of this issue which can be considered an impact to the regulatory goal.

Once the Outline is complete, the Cause Map itself is built by asking “why” questions beginning with one of the impacted goals. Starting at the safety goal in this example, the first step would be to ask “why” were 6 people injured?  These injuries occurred because people were burned because there was an uncontrolled fire in a classroom, people were near the fire and no protective gear was worn.  (When there is more than one cause that contributes to an effect, the cause boxes are listed vertically and separated by “and” to show that all causes were required.)  No information has been released to the public about why the students were sitting so near the open flame experiment without any type of safety barrier or why protective gear wasn’t worn, but these are both branches of the Cause Map that should be expanded during a complete investigation.  If the same fire had occurred, injuries may have been prevented or at least been less severe if the students were farther away from the flames or if they had protective gear on to protect them from burns.  It’s important to understand why the experiment was performed as it was in order to develop solutions that could prevent injuries in the future.

There has been a little information released about why the fire was uncontrolled during the experiment.  Eyewitnesses have stated that the teacher was adding more fuel to the fire because it was starting to burn out.  As liquid fuel was added, the fire spread unexpectedly and burning fuel splashed out of the experiment location onto students and the teacher performing the experiment.  The specific details of what occurred during this specific fire have not been released and should be looked at during the detailed investigation.  Once more information is known, the Cause Map could be easily expanded to incorporate it.

The Chemical Safety Board (CSB) is not investigating this incident, but has stated that it is gathering information on it.  The recent accident appears to be similar to three accidents involving open flame experiments that injured children during an 8 week period in 2014.  These three accidents all involved experiments using flammable liquid, a flashback to the bulk containers of fuel and fire engulfing members of the audience.  Following the 2014 accidents, the CSB issued a safety bulletin titled “Key Lessons for Preventing Incidents from Flammable Chemicals in Educational Demonstrations”.   Key lessons listed from the CSB safety bulletin that should be considered when planning open flame experiments are as follows:

– Do not use bulk containers of flammable chemicals in educational demonstrations when small quantities are sufficient.

– Implement strict safety controls when demonstrations necessitate handling hazardous chemicals – including written procedures, effective training, and the required use of appropriate personal protective equipment for all participants.

– Conduct a comprehensive hazard review prior to performing any educational demonstration.

– Provide a safety barrier between the demonstration and audience.

Not all McDonald’s franchise owners “lovin” the new menu

By Kim Smiley

Are you “lovin’ it” now that McDonald’s offers breakfast all day? If so, you are not alone because McDonald’s has stated that extended breakfast hours had been the number one request by customers. After recent declines in sales, McDonald’s is hoping that all-day breakfast will boost profits, but some franchise owners are concerned that extending breakfast hours will actually end up hurting their businesses.

Offering breakfast during the day is not as simple as it may sound because McDonald’s are now required to offer breakfast in addition to their regular fare.   Cooking only hash browns in the fryers is inherently simpler than figuring out how to cook both hash browns and fries at the same time. Basically, attempting to prepare breakfast simultaneously with traditional lunch and dinner items creates a more complicated workflow in the kitchen. Complication generally slows things down, which can be a major problem for a fast food restaurant.

If customers get annoyed at increased wait times, they may choose to visit one of the many other fast food restaurants, rather than McDonald’s, for their next meal out. Many franchisees are investing in more kitchen equipment and increasing staffing to support extended breakfast hours, both of which can quickly eat into the button line.  Increased profits from offering all-day breakfast will need to balance out the cost required to support it or franchise owners will lose money.

Franchise owners have also expressed concern that customers may spend less money now that breakfast is an option after 11 am.  Breakfast items in general are less expensive than other fare and if customers choose to order an egg-based sandwich for lunch rather than a more expensive hamburger it could potentially cut into profits.  It all depends on the profit margin on each individual menu item, but restaurants need to make sure they aren’t offering items that will compete with their more profitable offerings.

The changing menu also has the potential to frustrate customers (and frustrated customers will generally find somewhere else to buy their next lunch).  The addition of all-day breakfast has resulted in menu changes at many McDonald’s and more menu variability between franchises.  The larger the menu offered the more difficult it is to create cheap food quickly so some less popular items like wraps have been cut at many McDonald’s locations to make room for breakfast.  If you are a person who loves wraps and doesn’t really want an egg muffin, this move is pretty annoying.  The other potential problem is that most McDonald’s are only offering either the English muffin-based sandwiches or the biscuit-based sandwiches (but not both) after the traditional breakfast window.  So depending on the McDonald’s, you may be all fired up for an all-day breakfast Egg McMuffin to be told that you still need to get there before 10:30 am to order one since about 20 percent of McDonald’s have chosen to go with biscuit-based breakfast sandwiches instead.


There are multiple issues that need to be considered to really understand the impacts of switching to all-day breakfast.  Even seemingly simple “problems” like this can quickly get complicated when you start digging into the details.  A Cause Map, a visual root cause analysis, can be used to intuitively lay out the potential issues from adding all-day breakfast to menus at McDonald’s.  A Cause Map develops cause-and-effect relationships so that the problem can be better understood.  To view a Cause Map for this example, click on “Download PDF” above.

Studies have found that at least one quarter of American adults eat fast food everyday (which could be its own Cause Map…) so there are a lot of dollars being spent at McDonald’s and its competitors. Only time will tell if all-day breakfast will help McDonald’s gobble up a bigger market share of the fast food pie, but fast food restaurants will certainly continue trying to outdo each other as long as demand remains high.

Invasive Pythons Decimating Native Species in the Everglades

By Kim Smiley

Have you ever dreamed of hunting pythons?  If so, Florida is hosting the month-long 2016 Python Challenge and all you need to do to join in is to pay a $25 application fee and pass an online test to prove that you can distinguish between invasive pythons and native snake species.

The idea behind the python hunt is to reduce the population of Burmese pythons in the Florida Everglades.  As the number of pythons has increased, there has been a pronounced decline in native species’ populations, including several endangered species.  Researchers have found that 99% of raccoons and opossums have vanished along with 88% of bobcats, along with declines in nearly every other species.  Pythons are indiscriminate eaters and consume everything from small birds to full-grown deer.  The sheer number of these invasive snakes in the Florida Everglades is having a huge environmental impact.

The exact details of how pythons were released into the Everglades aren’t known, but genetic testing has confirmed that the population originated from pet snakes that were either released or escaped into the wild. Once the pythons were introduced into the Everglades, their number quickly grew as the python population thrived.  The first Burmese python was found in the Florida Everglades in 1979 and now there are estimated to be as many as 100,000 of the snakes in the area.

There are many factors that have led to the rapid growth in the python population.  They are able to live in the temperate Florida climate, have plentiful food available, and are successfully reproducing.  Pythons produce a relatively large number of eggs (an average of 40 eggs about every 2 years) and the large female python protects them.  Hatchling pythons are also larger than most hatchling snakes, which increases their chance of surviving into adulthood.  There are very few animals that prey on adult pythons.  Researchers have found that alligators occasionally eat pythons, but that the relationship between these two top predators can go both ways and pythons have occasionally eaten alligators up to 6 feet in length.  The only other real predators capable of taking down a python are humans and even that is a challenge.

Before a python can be hunted, it has to be found and that is often much easier said than done. Pythons have excellent camouflage and are ambush predators that naturally spend a large percentage of the day hiding.  They also are semi-aquatic and excellent climbers so they can be found in both the water and in trees.  Despite their massive size (they can grow as long as 20 feet and weigh up to 200 pounds), they blend in so well with the environment that researchers even have difficulty finding snakes with radio transmitters showing their locations.

The last python challenge was held about 3 years ago and 68 snakes were caught.  While that number may not sound large, it is more snakes than have been caught in any other month.  The contest also helped increase public awareness of the issue and hopefully discouraged any additional release of pets of any variety into the wild.  For the 2016 contest, officials are hoping to improve the outcome by offering prospective hunters on-site training with a guide who will educate them on swamps and show them areas where snakes are most likely to be found.

To view a Cause Map, a visual root cause analysis format, of this issue click on “Download PDF” above.  A Cause Map intuitively lays out the cause-and-effect relationships that contributed to the problem.

You can check out some of our previous blogs to view more Cause Maps for invasive species if you want to learn more:

Small goldfish can grow into a large problem in the wild

Plan to Control Invasive Snakes with Drop of Dead Mice

NTSB recommends increased oversight of DC Metro

By Kim Smiley

On September 30, 2015, the National Transportation Safety Board (NTSB) issued urgent safety recommendations calling for the Federal Railroad Administration to take over the task of overseeing the Washington, DC Metro system. The NTSB has determined that the body presently charged with overseeing it (the Tri-State Oversight Committee) doesn’t provide adequate independent safety oversight.  Specifically, the Tri-State Oversight Committee doesn’t have the regulatory power to issue orders or levy fines and lacks enforcement authority.

The recommendations resulted from findings from the ongoing investigation into a smoke and electrical arcing accident in a Metro tunnel that killed one passenger and sent 86 others to the hospital.  (To learn more, read our previous blog “Passengers trapped in smoke-filled metro train”.) The severity of damage done to the components involved in the arcing incident have made it difficult to identify exactly what caused the arcing to occur, but the investigation uncovered problems with other electrical connections in the system that could potentially lead to similar issues if not fixed.

Investigators found that some electrical connections are at risk of short circuiting because moisture and contaminants may get into them because they were improperly constructed and/or installed.  The issues with the electrical components were not identified prior to this investigation which raises more questions about the Metro’s inspection and maintenance programs.  Although the final report on the incident has not been completed, the NTSB issued recommendations in June to address these electrical short circuit hazards because they required “immediate action” to ensure safety.

Investigators have found other issues with the aging DC Metro system such as leaks allowing significant water into the tunnels, issues with inadequate ventilation and questions about the adequacy of staff training.   The final report into the deadly arcing incident will include recommendations that go far beyond fixing one electrical issue on one run of track.

This example is a great illustration of how digging into the details of one specific problem will often reveal information about how to improve reliability across an organization. It may seem overwhelming to tackle organization-wide improvements, but often the best way to start is with an investigation into one issue and digging down into the details.