All posts by Kim Smiley

Mechanical engineer, consultant and blogger for ThinkReliability, obsessive reader and big believer in lifelong learning

Lexington Plane Crash 2006

By Kim Smiley

Root cause analysis can be a very effective technique to analyze a problem.  But what if the evidence trail goes cold?  Is creating a Cause Map still useful when unanswered questions remain after a thorough investigation?  The crash of a Comair jet in Lexington Kentucky on August 27, 2006 is a good example of this situation.  The plane crashed during takeoff, killing 49 people . The flight crew mistakenly attempted to takeoff on the wrong runway, which was too short for the plane to reach the necessary speed for lift off.  Even after a detailed investigation by the National Transportation and Safety Board, it still is not clear why the flight crew used the wrong runway.   As an aside, the pilot and the first officer were competent professionals from all accounts and there is no history of either making errors of this magnitude.

Plane crashes are unique in the fact that there is a lot of data available to investigators.  The cockpit voice recorder (CVR) records all conversations in the cockpit and the flight data recorder (FDR) records instrument readings.  Usually the reason behind plane crashes can be determined using all this data.  In this case, the information did provide some useful insight, but no clear reasons why the mistake occurred.

High Level Cause Map

Buillding a Cause Map of this accident does make one thing very clear.  There are many events that had to occur for this mistake to happen.  One of the causes of the plane crash is clearly the error on the part of the flight crew, but another cause is the failure of the traffic controller to catch and correct the error.   There were two separate windows of time where the controller had an opportunity to prevent the plane crash, but didn’t for a variety of reasons.

It’s tempting to say the plane crashed because the crew used the wrong runway and leave it at that. The main problem with this line of reasoning is that this conclusion doesn’t help prevent future crashes, especially since the error isn’t well understood.  If all the focus is placed on why the wrong runway was used, an opportunity to improve the process and prevent future accidents is lost.  In a case where there is missing information, building a cause map can be useful because it helps the investigation to explore all the causes and potential solutions.  Only one cause needs to be eliminated to prevent the accident. For instances, the crew could had lined up at the runway and the accident could have still been prevented if the controller had caught the mistake.  Focusing on a solution to eliminate the better understood causes provides a useful place to start.

Learn more about the Lexington Plane Crash.

Levee Break – Fernley, NV

Download PDFBy Kim Smiley

Just after 4 a.m. on January 5th, 2008 about 600 homes began flooding in Fernley, Nevada, about 25 miles East of Reno.  A 50 foot section of a canal embankment failed flooding the adjacent area.  The 32-mile canal carried water from the Truckee River south to Fallon area farms.  There were no injuries in the flooding but it easily could have been very serious.  The complete estimates for repairing the canal and the homes are not available at this time.

A report issued by the U.S. Bureau of Reclamation released March 20th concluded that the century-old irrigation canal failed due to burrowing rodents.  A simple root cause analysis for this incident using the Cause Mapping method captures the tunneled holes in the embankment as one of the causes.  Another one of the causes is the increased water flow in the canal caused by the nearly 2 inches of rain that fell the day before.  The annual rainfall for the area is about 5 inches.

The Cause Map shows that the canal obviously failed because the stress on the embankment was greater than the strength of the embankment.  The increased water flow added to the stress on the embankment while the holes tunneled by the rodents reduced the strength.  A thorough root cause analysis built as a Cause Map can capture all of the causes in a simple, intuitive format that fits on one page.

Since the canal is almost 100 years old tunneling muskrats are not a surprise.  If the holes would have been identified earlier and filled, the risk of the breach would have been reduced significantly.  The evidence that the inspection and maintenance of the canals was ineffective is the fact that the canal failed due to holes.  An effective inspection program would have found the holes and addressed them – that’s the purpose of inspection and maintenance.  Past inspections may have been conducted exactly as required, which simply means the previous inspection requirements were inadequate.  Ineffective inspections is one of the causes of the canal failure that would need to be investitgated further.

The attached PDF file contains an intermediate level root cause analysis of the canal failure.  It includes causes that were considered in the Bureau of Reclamation report as well as some of the evidence and solutions.  A more detailed Cause Map can be created from the specific information in the bureau’s report.

18 Sailors Trapped in Capsized Tugboat

By Kim Smiley

On Sunday March 23, a Ukrainian tug boat collided with a Chinese registered cargo ship.  The tug boat capsized and sunk in 115 feet of water, trapping 18 sailors inside the hull.  All 25 passengers on the cargo ship and seven passengers on the tugboat were rescued.  Experts believe the trapped sailors could still be alive if they were able to find air pockets inside the boat.  Unfortunately, no signal or sound coming from within the capsized ship has been detected during the 9 rescue attempts that have occurred so far.  Rescue efforts continue, but are hindered by low visibility and strong currents.

There is very little information currently available on how the collision happened. Even through the details are vague, it can be very useful to apply the root cause analysis method during this stage of an investigation.  Knowing some of the basic causes that have to be present for each type of incident can help direct the investigation efforts.  For example, if a fire occurs you already know that there was a spark, oxygen and fuel present and you can start the investigation by considering each of these causes.

In the case of the tugboat collision, there are number of causes that had to be present for the collision to occur and they could be used as starting places for the investigation.  Beyond the really basic, like there had to be two ships present, there are a few facts that can be assumed from the beginning.  First, there are strict rules of the road that govern the path of ships, especially near land, similar to the laws that govern vehicle traffic.  Somebody didn’t follow the rules and if you can figure out who didn’t and why that will go a long way to explaining why the ships collided.  Second, every ship should have situational awareness and avoid other ships (even if that other ship is doing something strange) and both ships failed to keep their distance from the other ship.  Either this was a failure to properly monitor position or the methods used were inadequate.   In this specific case, from the damaged that both ships sustained,  I’d also be willing to bet that somebody was going to fast too close to shore.

Each type of accident has fundamental causes that had to be present for it occur.  While many investigations lead far beyond the causes that can initially be assumed, they can be helpful place to start.  Performing a root cause analysis can help guide an investigation and ensure all the pertinent questions are asked and answered.

Tacoma Narrows Part 2: Failure of a Design

By Kim Smiley

The mechanics behind the failure of the Tacoma Narrows Bridge were discussed in a previous blog entry.  There were many design issues with the bridge and the civil engineering community has done an excellent job of studying and incorporating lessons learned from the failure. But a question that may be more pertinent across all engineering disciplines is, “Why did the design process fail?”

How did a bridge get built that would fail in a little over four months?  A root cause analysis of the bridge shows that factors that shaped the doomed bridge design are present in almost every engineering project.  There is as much to learn from the failed process that led to the design as there is from the failed design.

The primary factor that led to the bridge design was cost reduction.  The first design proposed for the Tacoma Narrows Bridge was a conventional suspension bridge that was estimated to cost $11 million.  Funding was an issue for the bridge from the beginning, and the design that was finally approved for the bridge was an elegant bridge with a narrow roadbed and short girders.  In additional to being more aesthetically pleasing, the estimated price tag of $8 million dollars was nicer to look at as well. Another contributing factor is the engineer behind the second design, a very well-known civil engineer Leon Moisseiff.  His credentials were impeccable, and he had previously consulted on the famed Golden Gate Bridge, the Bronx-Whitestone Bridge and others.  Additionally, he helped developed some of the methods used throughout the world to calculate forces in suspension bridges.

In a tale that is probably repeating somewhere right now, a cheaper, flashier design was recommended by a well respected engineer.  Nobody wanted to listen to the voices of dissension among the less well-know engineers (and there were engineers who spoke out against the new bridge design saying it was unsafe).  The project then dramatically fails.

As engineers, there is a lot we can learn from studying how past projects have balanced cost and safety.   There are stories where remarkable profits and success have been achieved by finding a cheaper way to do something.  But sometimes, as in the case of the Tacoma Narrows Bridge, the cheap way costs more in the end.

Learn more about the failure of the Tacoma Narrows Bridge.

Tacoma Narrows: Failure of a Bridge

By Kim Smiley

The power of performing a root cause analysis of a problem can be demonstrated by working through well-known engineering disasters.  For example, creating a cause map for the failure of the Tacoma Narrows Bridge helps explain why the bridge collapsed and illustrates some of the lessons that can be learned.

The original Tacoma Narrows Bridge was opened for traffic on July 1, 1940.  A little more than four months later, the bridge violently failed and a 600 foot span of roadbed fell into the river below.  Why did the bridge tear itself apart?  What made the bridge collapse on November 7th and not some previous day?  One of the first questions asked when performing a root cause analysis is, “What is different about this issue?”   The first difference to consider was that November 7th was a windy fall day.  Construction of the bridge ended in the summer so this was the first fall the new bridge had experienced.  On the day the bridge failed, the wind was blowing across the roadbed at 42 mph.  This was the strongest the wind had blown since the bridge was constructed.  The second difference was the design of the bridge itself.  The Tacoma Narrows Bridge was particularly narrow relative to its length, making the roadbed more flexible than other suspension bridges.  Additionally, the bridge had shallow girders and was relatively weak in torsion compared to other suspension bridges built around the same time.  The combination of fall winds and the slender bridge design resulted in the collapse of the bridge.

High Level Cause Map

As the wind impacted the bridge, the force twisted the roadbed until it hit a point where it was constrained by the suspender cables, and then it twisted back in the other direction.  Other suspension bridges of the time experienced similar twisting motions, but what made this bridge different was that the amplitude of the motion increased with each cycle, rather than dying out.  The bridge was unable to dissipate the wind energy, and the motion of the bridge continued to grow until the twisting motion increased to the point where the suspender cables snapped and the roadbed was dropped into the river below.  The mathematical explanation of why the bridge collapsed is fairly complex, but simply put: the bridge was underdamped causing the twisting oscillations to increase rather than decrease with each twisting cycle.

Learn more in Part 2 of the blog.

UPDATE: US Beef Recall

By Kim Smiley

I wanted to add a few more interesting facts on the recent beef recall as the ramifications continue to surface.  As a quick recap, on February 17, 143 millions pounds of beef were recalled.  For perspective, that’s enough beef to make every person in the US about two hamburgers.  The scope of the recall is rapidly expanding and it may become the largest food recall in US history.  The full magnitude of the recall is just now becoming apparent because it takes weeks to track down all the products containing the recalled beef.

Take a second to think of all the products in a grocery store that contain beef and you can imagine how large this recall is likely to become.  The amount of food that is going to be destroyed is mind boggling and the cost is likely to be in the hundreds of millions of dollars.  Keep in mind that no cases of illness have been reported, a large amount of the beef has already been consumed, and the U.S. Department of Agriculture classifies the risk to consumers as remote.  Does it make sense to destroy all this food? As you consider the scope of the recall, I ask you also to consider a root cause analysis of the problem.

The previous blog asked the question, what is the best approach to prevent this type of problem from happening again? I still don’t now the answer, but I do know that a recall alone does not solve the initial problems that caused the issue.  What cause really lead to sick cows being mistreated and then slaughtered for human consumption?  A recall deals with the problem after the fact and a good solution would change something in the process prior to the meat entering the food chain.  The USDA has stated that it will not be increasing inspections at food processing plants and I haven’t found any evidence that other changes are being made in the work process at the slaughterhouses.  I’ll be continuing to cook my meat well done.

Largest Beef Recall in US History

By Kim Smiley

One of the most interesting things about root cause analysis is its widespread application.   As an engineer, I tend to think about root cause analysis applying to mechanical failures, safety incidents or manufacturing issues, but it can be applied to any system.

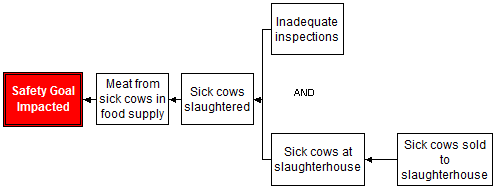
Take for instance the recent beef recall.  The largest beef recall in US history was initiated on February 17 when Westland/Hallmark Meat Company recalled 143 million pounds of beef.  What started the whole thing was an undercover video distributed by the Humane Society of the United States which showed workers kicking, shocking and even fork-lifting sick cows to force them on their feet so they could be slaughtered.  Beyond the animal cruelty issues (two workers involved have since been charged), the issue is that meat from sick cows was processed and sold.  Government regulations ban cows that can not walk from entering the food supply because consumption of their meat may lead to illness, including mad cow disease.

So how did sick cows end up being slaughter and sold to millions of people?  What is the best approach to prevent this type of problem from happening again?  Is the answer that we need more government regulations, more frequent inspections or stricter penalties for companies that violate the current regulations?  Whose fault is it?  Is it the farmers for selling the cows, the health inspectors for missing sick cows or the slaughterhouses for processing sick cows?  Performing a root cause analysis would show you that there isn’t one right single answer.  All you have to do is look at the recent increase in beef recalls to realize that a simple, single cause solution won’t work.  There were five recalls in 2005, eight in 2006 and 21 recalls in 2007.  These recalls were not limited to one plant or even one company.  Clearly, fining one company or firing a few workers isn’t going to fix the beef supply issues.  You need to attack the root of the problem to keep it from growing back and to do that you need to find the root causes (plural).  The information needed to do a detailed analysis isn’t available to the public yet, but a very basic root cause analysis follows.High Level Cause Map