All posts by Kim Smiley

Mechanical engineer, consultant and blogger for ThinkReliability, obsessive reader and big believer in lifelong learning

11 Year Old Flies to Rome from England without Ticket or Passport

By Kim Smiley

On July 25, 2012, an 11 year old boy managed to sneak aboard a flight to Rome from Manchester England without a ticket or a passport.  No one noted the presence of the extra passenger until other passengers informed airline staff that the boy had told them he was running away from home and seemed suspicious.  The timing of this incident was unfortunate since it occurred a few days before the start of the Olympics and raised more questions about British security.

How did a boy manage to depart on an aircraft without any of the proper documentation?  This incident can be analyzed by building a Cause Map, a visual root cause analysis which intuitively shows the relationships between the causes that contributed to the issue.
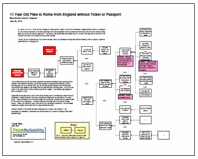
In this example, the boy was able to sneak onto the flight because the extra passenger wasn’t noted in the head count and he got through five separate security checks.  The boy did not circumvent any of the normal security checks, he just walked through them without showing a shred of paper or anybody questioning him or stopping him.

The boy was able to get into the secure departure area without showing a ticket, get through the passport check without a passport, get through security screening without showing a ticket or boarding pass (he did go through the x-ray), get through the gate passport and boarding pass check without any paperwork and finally board the plane without a boarding pass.  Add in the final failure of the head count to notice an extra body and an English 11 year without any paperwork was on his way to Rome.

Apparently the boy was able to pull off this feat by sticking close to families with children and took advantage of situations where one family member was showing the documentation for a large group.   Video surveillance from the airport shows him acting very confident and his behavior gave no one reason to be suspicious.  The airport was also very busy due to the summer holiday season. Throw in an ineffective head count and the end result was a significant, if not particularly dangerous, security breach days before a huge international event.

Several members of the airline staff were suspended as a result of this incident.  A full investigation is underway to understand the incident and work to ensure something similar never happens again.

To view a high level Cause Map of this incident, click on “Download PDF” above.

Navy Jet Crashes into Apartment Building

By Kim Smiley

On April 6, 2012, a Navy F-18 jet crashed into an apartment building in Virginia Beach, Virginia. Significant damage was done to the apartment building and the jet was destroyed, but amazingly no one was seriously injured or killed.

This incident can be analyzed by building a Cause Map, an intuitive, visual format for performing a root cause analysis.  The first step when building a Cause Map is to determine how the incident affected the organizational goals.  The impacts to the organizational goals are recorded in the Outline which also documents the background information of the incident.  In this example, the safety goal was obviously impacted since there was potential for serious injuries.  The property goal was also impacted because the jet was destroyed and the apartment building suffered extensive damage.

Once the Outline is complete, “why” questions are asked to determine what factors contributed to the incident.  In this example, there was potential for injuries because a jet hit an apartment building.  This occurred because the jet was flying near the residential area and the jet was unable to complete its attempted take off.  The pilots could have been injured had they not been able to safety eject before the crash and there was potential for people on the ground to be injured since the jet crashed into a residential area. The jet crashed because it experienced a dual engine failure.  The investigation into this crash determined that that both engines failed for two separate, unrelated reasons.

The right engine failed because of a catastrophic failure of the engine compressor when it ingested flammable liquid that was ignited.  The left engine afterburner failed to light. Investigators believe that an electrical component failed, but the damage to the left engine was too severe for a conclusive determination of what exactly occurred.   According to the Navy, this is the first unrelated dual engine failure of a F-18.

The Navy plans to update procedures to incorporate the possibilities of this type of incident.

To view a high level Cause Map of this issue, click on “Download PDF” above.
Lead Poisoning Threatens California Condor Population

By Kim Smiley

A recent study found that lead poisoning remains a significant hurdle to the recovery of the California condor population, one of the world’s most endangered species.  Scientists reviewed blood samples taken from wild California condors between 1997 and 2010 and found that many birds have dangerously high levels of lead in their bodies.  Nearly half of the birds had lead levels that were high enough that they could have died without treatment.

This issue can be analyzed by building a Cause Map, a visual root cause analysis. The first step in beginning a Cause Map is to determine the impact to the overall organization goals.  In this example, the environmental goal is impacted because an endangered species is threatened.  To continue building the Cause Map, “why” questions are asked and the answers are added to the Cause Map to show the cause-and-effect relationships between the things that contributed to the issue.  To view a high level Cause Map of this issue, click “Download PDF” above.

In the case of California condors, the species is threatened because the birds are ingesting lead and it’s dangerous.  Lead is dangerous because it is a poison that can cause illness or death.  The birds are ingesting lead because they eat a large number of animals and some of the animals contain lead.

There is lead in some of the animals because California condors will eat gut piles and carcasses left behind by hunters and these animals may contain fragments from lead bullets.  Additional causes are the fact that lead bullets are very common and that hunting is allowed in condor country.  This is caused in part because condors have large habitats because of their large range.  Condors are huge birds with wingspans of nearly 10 feet and they must travel long distances to find the large amount of food they require.

Determining the best way to prevent lead poisoning in condors is a difficult question for scientists.  Part of the problem is that a very small amount of lead can cause dangerous lead levels in a condor.  A single bullet fragment can be deadly. The short term solution is to treat the birds for lead poisoning by feeding them calcium-based drugs that bind with lead and remove it from the birds. One solution that has been tried is a California law banning lead bullets in the areas populated by condors, but the study found that it has had little impact in lead levels.  The issue of how to deal with the California condor lead poisoning issue without extensive ongoing human intervention and medical treatment remains open.

Deadly Kansas City Walkway Collapse

By Kim Smiley

On July 17, 1981, the second and fourth floor suspended walkways collapsed at the newly opened Hyatt Regency of Kansas City, Missouri.  A dance contest had attracted a crowd and the atrium under the walkway was filled with people.  This accident killed 113 people and injured 186.

The hotel was newly constructed and the walkways were well maintained.  So how did this happen?

A root cause analysis of this accident shows that there were a number of causes that contributed to the walkways collapsing.  Investigation into the accident shows that the structural design of the walkway was inadequate.  A weld failed which allowed a support rod to pull through the box beam and the walkways fell.

Additionally, the weld had greater stress than normal on it at the time of the failure because a large crowd had gathered to watch a danced content.  About 20 people were on second floor walkway and about 40 were on the fourth floor walkway at the time of the accident.  The higher loading combined to the walkway collapse.

Identifying the failure mechanism is important during an investigation, but a thorough root cause analysis needs to take the analysis farther to really understand the causes.  The reason that an inadequate design was built needs to be determined.

In this case, it appears that the design was changed without approval of the structural engineer.  This resulted from a communication error between the fabricator and the structural engineer.  The structural engineer sent a sketch of a proposed walkway design to the fabricator, assuming that the fabricator would work the details of the design himself. The fabricator assumed the sketch was a finalized drawing.   The fabricator then picked standard parts to fit the sketch.  This resulted in a significant change from the original design and dramatically decreased the load bearing capacity of the walkways.

The original design called for continuous hanger rods (a non-standard part that would have needed to be manufactured) that passed through the fourth floor walkway beam box to the second floor walkway, resulting in the ceiling connecting supporting the weight of both walkways.  The fabricator changed the design to use two shorter rods (standard parts) which resulted in the fourth floor walkway supporting the weight of the second floor walkway, which it wasn’t designed to handle.

It’s important to investigate beyond the point of inadequate design to learn what failed in the design process to prevent future accidents from occurring.

Is Lard The Misunderstood Fat?

By Kim Smiley

For many of us the word lard instantly invokes images of clogged arteries and heart disease.  A hundred years ago, lard was a staple item in nearly every pantry, but today few of us can imagine cooking with such an unhealthy substance.

But what if lard isn’t as bad as the collective knee jerk reaction would lead us to believe?

While lard is certainly not olive oil, the reality is that lard is actually a relatively healthy option when a solid fat is needed.  This is true because most of the fat in lard is monounsaturated fat, which is healthier than saturated fat.  The fat in lard is 40 percent saturated compared with 60 percent saturated fat in butter.   The partially hydrogenated fats found in vegetable shortening are now considered to be the least healthy option.  While Crisco no longer contains trans-fats, lard has always been naturally trans-fat free.

So how did lard get such a bad reputation?  A Cause Map, a visual, intuitive root cause analysis format, can be built to explore this question.  To view a high level Cause Map of this example, click on “Download PDF” above.

A recent article from National Public Radio tried to answer the question – who killed lard?  The article claimed that a number of factors contributed to the fall of lard’s popularity.  The public became uneasy about the pork industry after the publication of Upton Sinclair’s The Jungle.  Included in the book was a disgusting scene that depicted workers falling into vats of lard and being sold along with it for human consumption which understandably cooled the public’s appetite for lard.

A second major factor was that an alternative fat product became available that offered an option to a public queasy about the pork industry.  Crisco came on the market, armed with a massive marketing campaign, offering a fat option that wasn’t associated with the pork industry.  The creation of Crisco was possible because of the invention of hydrogenation and a surplus of cottonseed oil.  The oil had previously been used to manufacture candles, but the invention of the light bulb had dimmed the demand.

At about the same time Crisco was hitting shelves, scientist began asking questions about the saturated fat in lard.  Ironically the bad publicity about the health impacts of trans-fats (which were in shortening at the time) was years away, but the early findings that linked saturated fat to heart disease were another strike against the popularity of lard.

Today, lard is making a comeback with foodies, but it still isn’t widely used and it is difficult to find in stores.  Only time will tell if lard will once again became a popular pantry staple.

Deadly Stage Collapse at State Fair

By Kim Smiley

On August 13, 2011, a stage at the Indiana State fair collapsed, killing seven and injuring dozens more.  The accident occurred just before 9 pm as a crowd waited to watch the popular country band Sugarland perform.

Why did the stage collapse?  What caused this tragic accident to occur?

This incident can be analyzed by building a Cause Map, an intuitive, visual format for performing a root cause analysis.  The first step when beginning a Cause Map is to determine what goals have been impacted.  In this example, the focus will be on the safety goal since there were fatalities and many injuries.  Once the impact is determined, the Cause Map is built by asking “why” questions to determine what causes contributed to the accident.

In this example, people were killed and injured because they were near the stage and the stage collapsed.  They were near the stage because they were waiting for a concert and the area had not been evacuated.  The area had not been evacuated because the decision to evacuate wasn’t made in time.  The decision didn’t happen in a timely manner because it wasn’t clear who had the authority to make the decision because there was not an adequate emergency plan in place.  The bad weather wasn’t a surprise.  The storm was being monitored and the National Weather Service had issued a warning, but the decision to evacuate wasn’t made until too late to prevent the tragedy.

Recently findings by investigators determined that the stage collapsed because it wasn’t up to code.  The structure was required to be able to withstand winds up to 68 mph, but the stage collapsed at winds below this limit.  Investigators determined that the lateral supports were inadequate and the stage wasn’t strong enough to stand up to the wind.  The stage also wasn’t inspected because it was a temporary structure and they are not required to be inspected.

On Tuesday, (April 17, 2012)  Indiana Governor Daniels reported that he has ordered temporary outdoor structures to be inspected by the Indiana Department of Homeland Security to help prevent a similar accident in the future.

To view a high level Cause Map of this incident, click “Download PDF” above.

Cleaning Up Aerosols May have Fueled Hurricanes

By Kim Smiley

A recent study by Britain’s Met Office weather service found that reducing pollutants in the atmosphere has had an unintended consequence, an increase in intense hurricane activity in North America.

A Cause Map, a visual root cause analysis, can be a helpful tool to understand this type of issue.  A Cause Map shows the cause and effect relationships between the different causes that contribute to an issue and can illustrate the potential consequence of changing one cause.

In this example, the problem is that hurricane activity has been increasing in the Atlantic Ocean.  Previous studies have found a link between a rise in ocean temperature and the increase in hurricane activity. Higher temperatures result in more intense hurricanes because there is more water vapor in the air because more water evaporates at higher temperatures.  More heat is released as the water vapor condenses into rain and this heat fuels the hurricane.

The surface temperature of the Atlantic Ocean has increased a small amount, about half a degree Celsius since 1970.  Scientists are not in agreement about the cause of this temperature increase.  Some people believe that the change is simply part of the natural long term variability of ocean temperatures.  Other scientists believe that global warming has caused the higher temperatures.  This new study adds a new dimension to the discussion.

The Met office study found that the reduction in aerosol pollutants in the air caused the rise in the ocean temperature.  Aerosols play a role because they affect the way clouds form.  More aerosols result in brighter, longer lasting clouds so reducing the aerosols in the atmosphere means that there will be fewer clouds over the ocean.  Fewer clouds mean that less sunlight is reflected away.  All this means that more sunlight will hit the ocean, increasing temperatures.

Fewer aerosols are in the environment because they cause acid rain and legislation was passed that limits how much can be released into the environment.

This issue is further complicated when the weather pattern is viewed on a global scale.  When the ocean temperature is cooler, there is less hurricane activity bombarding the United States, but then there are severe droughts in Africa.  Additional studies will be needed to confirm the findings on the effects of aerosol pollutants, but this new information is an interesting piece of the climate puzzle.

School Leveled by Gas Explosion

By Kim Smiley

On March 18, 1937, the London School of New London, Texas was leveled by a huge explosion.  Unfortunately, many people were in the school on the afternoon of the explosion and an estimated 280 students, 15 teachers, 2 visitors and a school secretary were killed.  This tragedy remains the worst catastrophe to occur inside a school in American history.

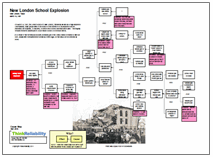
The cause of this tragic incident can be investigated by building a Cause Map, a visual root cause analysis, which shows the cause and effect relationships between the different factors that contributed to the explosion.  A Cause Map begins by determining which goals were impacted and in this example the safety goal is the obvious focus.  Causes are then added to the Cause Map by asking “why” questions to add additional information.  In this example, the safety goal was impacted by the large number of fatalities.  The deaths occurred because the school was occupied and the school was destroyed.

The school was destroyed because there was a large natural gas explosion.  The explosion occurred because there was a large quantity of natural gas in the school and a shop teacher turned on a sander and created a spark.  The gas was in the school because there was a leak, there was a large quantity of gas was trapped in a void space under the school and the gas leak wasn’t detected.  The investigation into this incident was never able to decisively determine what caused the natural gas leak.  The void space was under the school because the school was built on a slope.  The leak wasn’t detected because the school was using untreated natural gas which is both invisible and odorless.

Why was the school using untreated natural gas?  The school was trying to save money by eliminating their heating bill.  The school was located near oil fields and had tapped into a nearby residue gas line to provide heat, saving approximately $300 dollars a month.  Using free untreated natural gas was a common practice in the region.  The gas company turned a blind eye since natural gas was considered a waste product of oil drilling that was just flared off.

The end result of using free, but untreated natural gas was that no one could detect that the school was filled with natural gas.  One spark and the whole school was destroyed along with many, many lives.

As a result of this horrendous accident, all natural gas in the United States is treated to have an odor, usually with mercaptan which smells like rotten eggs, so that leaks can be detected by smell.

Girder Fell on Car, Killing 3

by Kim Smiley

On May 15, 2004, a girder fell off an overpass and hit a car driving on the road below, killing all three occupants of the vehicle.  The National Transportation Safety Board (NTSB) investigated the incident to determine what caused the fatal accident.  The findings from the investigation can be used to build a Cause Map, a visual root cause analysis, which illustrates the causes that contributed to the accident.

In this example, the girder hit the car because it fell from an overpass and the car was driving on the road below it.  The girder was temporarily installed on the overpass because it was being used to add two additional lanes to the overpass.  The work was being performed at night in effort to minimize the impact on the heavy traffic that normally used the roads involved.  The workers believed the girder attached to the overpass was in a safe condition so they had opened the road beneath it to traffic.

The girder fell because it was inadequately fastened to the overpass.  The NTSB determined that the girder wasn’t installed plumb to the bridge and it was inadequately bolted to the bridge which allowed the girder to twist and ultimately fall.  The investigation also determined that the girder was inadequately fastened because the project wasn’t planned well.  The original work plan called for two girders to be spliced together and then fastened to the bridge, but a delay in work meant that the subcontractor was only able to get one girder up before the work was halted to allow the roads to be opened for morning rush hour.  (Weather delays postponed the work further and the single girder was fastened to the bridge for several days prior to falling.) There were also no Professional Engineers involved in the planning and no formal drawings created of how one girder would be fastened to the bridge.

The NTSB investigation also determined that the guidance that governed bracing was inadequate.  The language used was confusing and there was a lack of consistent standards.  The oversight of the contractor’s work was also inadequate since the inspector did not notice that the girder wasn’t secured adequately.

As a result of this investigation, the NTSB made several specific suggestions to revise bracing standards to improve clarity.

To view a high level Cause Map of this incident, click “Download PDF” above.

Deadly Train Collision in Poland

By Kim Smiley

On March 4, 2012, two passenger trains collided head-on near Szczekociny, Poland killing 16 and injuring 58.  It was Poland’s deadliest train crash in 20 years.

An investigation is underway to determine what caused the deadly accident, but an initial Cause Map can be built now and more details can be added as information becomes available.  A Cause Map is a visual root cause analysis format.  The first step in the process is to determine which organizational goals were not met and in this example the obvious goal to focus on is the safety goal.

The safety goal wasn’t met because there were fatalities and injuries.  This occurred when two trains crashed because they were traveling on the same track in opposite directions.  It’s not clear exactly how the trains ended up on the same track, but it appears human error was involved since prosecutors have announced plans to charge a controller for unintentionally causing the accident.  Media reports have also stated that the routing mechanism for one of the trains was set incorrectly so that it was sent down the wrong track and into the path of the other train.  As with any investigation that leads to human error, more information will be needed about why the mistake was made in order to fully understand why the accident occurred and determine what would be needed to prevent a similar one in the future.  In this case, we can also assume that the accident was caused by inadequate oversight of the controller or lack of a double check of the mechanisms because an ideal system won’t allow one single mistake to result in a deadly accident.

Another fact worth considering is that the rail system in Poland is in the midst of a massive modernization effort.  Poland’s rail system is being modernized to prepare for the huge crowds expected to travel to the Euro 2012 soccer championship this July.  The modernization effort has been possible in part because of subsidies offered by the European Union, which Poland joined in 2004.  As part of the modernization, more connections have been added and more trains have been running on the track where the accident occurred.  It isn’t clear yet if any of the changes contributed to the accident, but any recent changes to a system are worth reviewing during an accident investigation.

As more information is found during the investigation, the causes can easily be incorporated into the Cause Map to capture as much detail as needed.  To view a high level Cause Map, click “download PDF” above.