Tag Archives: safety

Beijing’s “Airpocalypse”

By Kim Smiley

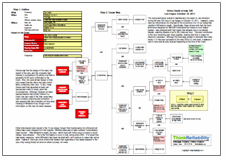
Beijing’s air pollution was at levels considered hazardous to human health for nearly a week during mid-January 2013.  During this event, colorfully dubbed the “airpocalypse”, pollution levels peaked at 755 as measured by the Air Quality Index (AQI).  This value is considered “Beyond Index” because it is well above the 500 which is considered the maximum AQI value.  Any AQI value over 300 is considered hazardous.

This issue can be analyzed by building a Cause Map, an intuitive format for performing a visual root cause analysis.  The first step in building a Cause Map is to fill in an outline with the basic background information.  The impacts to the organizational goals are also listed in the Outline.  In this example, the safety goal is impacted because people are reporting respiratory issues and there is a possibility of long term health problems because millions were exposed to hazardous air pollution.  The customer service goal has also been impacted because of the negatively publicity that the air pollution issues have generated.  The impacts to the goals are used to build the Cause Map by asking “why” questions.

Why were millions exposed to hazardous air pollution?  This happened because there was air pollution produced in and around Beijing and the pollution was trapped in the city.  A number of sources contributed to the air pollution.  There are many coal burning factories in the area and the amount of coal burnt as a heat source has increased recently because of unusually cold weather.  The number of cars in the city is also increasing at an amazing rate, with thousands more added to the city traffic daily.   There is also a lot of construction in the city needed to meet the demands of such a large population. The pollution was trapped in the city because of the city’s geography and the weather.  Beijing sits on a plain and is flanked by hills.  If the wind doesn’t blow in the right direction to push the  pollution out to sea, it will be trapped by the hills and blanket the city, which is what happened in this case.

The final step in the Cause Mapping process is to develop and implement  solutions to prevent the same thing from recurring.  The Chinese government did take several steps to try to mitigate the  immediate problem with the air pollution by limiting the use of cars and temporarily shutting down some factories.  The pollution finally cleared up as the wind began to blow, but continued efforts will be needed to prevent similar issues in the future.

To view an outline and high level Cause Map of this issue, click on “Download PDF” above.

Over 60,000 Vehicles Recalled Due to Steering Column Defects

By Kim Smiley

General Motors Co has announced a recall of over 69,000 full-size trucks and vans because of steering column defects that may allow a parked car to roll away.  Only about 1 in 1,000 of the recalled vehicles is expected to have the defect.

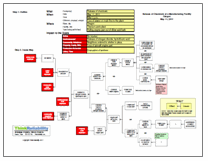
This issue can be analyzed by building a Cause Map, or visual root cause analysis.    A Cause Map is an intuitive way to visually show the cause-and-effect relationships between the many causes that contribute to an issue.  In this example, the recall was announced because there are a large number of vehicles that need to be inspected.  The inspections are necessary because some vehicle need to have the steering columns replaced.  The replacements are necessary because a small percentage of vehicles have defective steering columns that may allow a parked car to roll.

Investigation into the steering column defects found that there were two separate issues causing similar problems.  There is a possibility that the column lock module assembly might malfunction because of a manufacturing issue with a component.  Investigators also found that some shift cables had been fractured because of mishandling.  Both issues resulted in the same potential safety issues.  If the steering column defects are present a parked car could roll away because it may be possible to shift from park when the key is removed or in “off” position, shift from park with application of brake pedal with key in “off” position, or to turn the key to the “off” position and remove while not in park.  To view a high level Cause Map of this issue which includes all these causes, click on “Download PDF” above.

Once the Cause Map is built, the final step in the process is to determine a solution to prevent recurrence.  Once the problems were identified the solution was fairly straightforward.  The recall was initiated to inspect all vehicles potentially affected by these issues and replace the steering column if a defect is found.

A recall is never a good thing for a company, but one silver lining in this incident is that the company identified the problem during an audit before receiving any reports of issues.  There have been no reports of accidents or injuries caused by these steering column defects.  The majority of the vehicles are also believed to be either in transit to dealers or sitting on dealer lots so a limited number of customers should be impacted by the recall.


Toyota Recalls Millions of Vehicles Because of Fire Risk

By Kim Smiley

On October 11, 2012, Toyota announced a recall of 7.4 million vehicles worldwide due to a potential fire hazard.  This newest recall comes on the heels of the heavily publicized unintended acceleration issue and puts Toyota once again in an unwanted spotlight.

A Cause Map, a visual format for performing a root cause analysis, can be built to help analyze this issue.  The first step in building a Cause Map is to create an Outline that lays out how the issue impacts the overall goals of an organization.  In this example, the safety goal is impacted because of the potential for injuries and car accidents.  The production goal is impacted because of the effort needed to recall millions of vehicles.  The customer service goal is also impacted because of the negative publicity that a recall of this size will generate.  After the impact to the goals is determined, “why” questions are asked to determine what causes contributed to the issue and to create the Cause Map.

Starting with the production goal, we would ask “why” millions of vehicles were being recalled.  This is happening because there is a component that may need to be repaired, the component is in many vehicles and there is a potential for injuries if the component isn’t repaired.  A component needs to be repaired because the power-window switches pose a fire risk.  Some of the power-window switches feel sticky when operated and if some commonly available lubricants are applied it will create a fire hazard because the switch can melt.  There are millions of these power-window switches to repair because they were used across multiple models for several years because using standard parts is usually cheaper.  There is a potential for injuries because a fire starting in the power-window switch while the car is driving would be pretty distracting.

This recall will generate negative publicity because it is a huge recall, the a largest vehicle recall since Ford Motor Co recalled 7.9 million vehicles in 1996, and the timing is a bit unfortunate since it comes shortly after the unintended acceleration issues that resulted in large recalls.  In fact, some of the vehicles being recalled this round are the same vehicles that have had previous recalls, a fact that probably isn’t reassuring to owners.

The good news is that the fix for this problem is relatively simple beyond the innate hassle of taking a vehicle to the dealer.  The recall consists of a technician inspecting, disassembling and applying approved fluorine grease to the power-window switch, improving the sticky operation and decreasing the likelihood that some handy soul might apply an unapproved lubricant and inadvertently melt the part.

To view a high level Cause Map of this issue, click on “Download PDF” above.

Knife Cuts in Restaurants

By ThinkReliability Staff

Knife cuts in restaurants pose a big risk, not only to the restaurant employees themselves, but also to customers due to the potential risk of contamination by blood or bandages as a result of an employee who receives a laceration due to a knife cut.  There are steps that can be taken to reduce the risk of a knife cut.  While some of these steps can be taken by restaurant employees themselves, many will involve the restaurant management as well.  Although these recommendations are based on knife cuts that occur within the restaurant and food preparation industry, they are also relevant for use at home to protect against lacerations from knives.

You can view some different causes that can result in lacerations from knives in a Cause Map, or visual root cause analysis, by clicking “Download PDF” above.   With any root cause analysis, the goal is to determine as many solutions as possible to reduce the risk of the issue – in this case, knife cuts – from happening in the future.  When we put together a proactive investigation – not based on one specific incident, but rather combining any possible causes we can brainstorm to best determine solutions – we can use some examples of actual lacerations that have occurred, and also our personal experiences to brainstorm causes.  As with any investigation, the wider net we cast, the more ideas we brainstorm and the more possible solutions we can discover.

The setup of the food prep area is key to reducing cuts.  Inadequate lighting and distraction can lead to increased injury, as can the storage location of the knives.  (You’re much more likely to cut yourself grabbing a knife out of a drawer than off a magnetic strip or out of a block.)  The condition of the knives themselves is also key.  Properly maintained knives – that is, knives that are sharpened and the handles are properly attached – are less likely to cause cuts because dull knives, or those with loose handles, make it difficult to cut properly, increasing the risk of cuts.  Knives should be regularly sharpened and if a knife is damaged, it should be disposed of.  In addition, having the proper compliment of knives is important.  Proper cutting technique can reduce knife cuts, but a key component  to proper cutting technique is having the correct knife.

An additional component of proper cutting technique is training.  Training should include techniques for cutting as well as which knife to use for which type of cutting and what kind of food product.  Some of the key aspects to knife cutting technique that can decrease the incidence of knife cuts include: cut away from you, using a cutting board with a mat to keep it from slipping.  Hold objects with your fingers pointing straight down, using your knuckles as a guide for the knife.  It’s very difficult to cut yourself while holding a knife this way.

Not all knife cuts occur while cutting food.  One frequent source of knife cuts is reaching into a sink full of soap water and grabbing a knife blade.  When hand washing knives, put it one knife at a time and don’t let go of it.  Always set knives well onto the counter with the blade facing away from you.  And if a knife falls off a prep surface, step back and let it fall.  If you are particularly concerned about knife cuts, you may want to consider the use of Kevlar gloves.  Restaurants that use Kevlar gloves have seen a remarkable decrease in injuries due to knife cuts.

To view the Cause Map, please click “Download PDF” above

Slips, Trips and Falls: A Root Cause Analysis Primer

By ThinkReliability Staff

Slips, trips and falls happen every day.  Falls are responsible for tens of thousands of deaths each year.  (Slips and trips are considered a subset of falls, and are included in these numbers.)  Falls on the job account for 12-15% of all worker’s comp costs.  The direct and indirect costs of workers injured and killed on the job are estimated to be billions of dollars each year, both in worker’s comp claims and in lost productivity.  In 1999, as an example, 5,100 workers were killed by falls and over 570,000 injuries were reported.  However, there are many things that can be done to prevent and lessen the impact of falls.  Performing a Cause Map, a visual root cause analysis, will allow us to identify all the potential causes of falls.  A thorough root cause analysis built as a Cause Map can capture all of the causes in a simple, intuitive format that fits on one page.  Once we’ve done that, we can identify all the solutions.

A worker is injured during a fall because the worker strikes the floor, or another object, and the object contacted is hard, and the worker hits in a way that causes injury.  When we say that workers are injured because they hit an object in a way that causes injury, what we are really talking about is factors that worsen a fall, and make injury more likely. The worker could land on a part of his or her body that is more easily injured.  Another way that injuries can be worsened is if a worker falls farther than his or her height (i.e., not a same-level fall).

The worker strikes the floor or other object because he or she falls, and there is no other support for the body, such as a handrail, or a harness.   There are four different ways to fall: slips, trips, the “step and fall” (where a person gets off-balance while stepping), and becoming unbalanced on moving equipment.

A worker slips when there is inadequate traction, either because the force of stepping off is too high, or the coefficient of friction is too low.  The force of stepping off can be higher than average if the worker is walking quickly or running, making a sudden change in direction, or if he or she has an awkward gait, from injury or old age, for example.  The coefficient of friction is a function of the traction provided by the shoes the worker is wearing and the “slipperiness” of the walking surface.  The coefficient of friction is too low if the traction of the worker’s shoes is inadequate and if the floor is slippery, because the surface is wet, icy and/or oily and does not have a non-skid coating.  Of course, for this to be an issue at all, the worker has to step into the slippery area.

A worker can become off-balance by encountering an unexpected height difference (known as the “step and fall”).  This occurs in one of two ways.  Either the front foot lands on a surface lower than expected, or the ankle turns due to one side of the foot ending up higher than the other side, with footwear that inadequately supports the ankle.  These are both due to an unexpected height difference.

When a worker trips, it is because his or her toe is stopped, but his or her upper body is not stopped.  The upper body is moving because the worker is moving and he toe is topped because it encounters an object in the walking path, a rise in the walking path, or a difference in height of subsequent stairs.

Last but not least, falls can be caused by workers who become unbalanced on moving equipment.  For this to occur, the worker must be inadequately secured to the equipment while the equipment changes motion, either by turning, decelerating or stopping, or accelerating or starting to move.

Once we have built our Cause Map and found all the potential causes, we can assign potential solutions to all appropriate causes.  The solutions are in green boxes, near the cause(s) they “solve”.   You can see that some of the solutions are the responsibility of the company, and some are the responsibility of the worker, and some are both.   Although many of the responsibilities lie with the worker, it is in a company’s best interest to provide training on how to prevent, manage and mitigate falls.  Falls may seem like everyday, ordinary minor occurrences, but the consequences can be anything but minor.

Radioactive Release in the 1960s due to Inadvertent Dropping of Nuclear Weapons

By ThinkReliability Staff

In the history of nuclear weapons in the U.S., two accidents (or inadvertent drops) of nuclear weapons have resulted in widespread dispersal of nuclear materials.  These two incidents occurred two years apart, within a week.  The incidents had many similarities: in both cases, a B-52 bomber carrying nuclear weapons was damaged in air during an airborne alert mission and released nuclear weapons, which released radioactive material over a large area.  In both cases, there were significant impacts to the safety, environmental, customer service, property and labor goals.

Palomares: On January 17, 1966, a B-52 and KC-135 crashed during refueling above Palomares, Spain.  The KC 135 exploded, killing the entire crew of four.   The B-52 broke up mid-air, killing three crew members (four more were able to eject) and releasing four nuclear weapons.  Two of the weapons’ parachutes failed, and the weapons were destroyed, releasing radioactive material causing extensive cleanup of the 1,400 contaminated tons of soil and debris.  (Additionally, one of the intact bombs fell into the ocean and was not recovered for three months.) This was the third refuel of the mission and it’s unclear what exactly went wrong, though due to the close proximity required, mid-air refueling is extremely risky.

Thule: A fire began in a B-52 when flammable cushions were stuffed under a seat, covering the heat duct.  Hot air from the engine manifold was redirected into the cabin in an attempt to warm it up, which ignited the cushions.  The crew of the B-52 was unable to extinguish the fire and the pilot lost instrument visibility.  The generators failed (for reasons that aren’t clear), cutting all engine power.  The crew bailed, the plane crashed, and the two weapons were destroyed along with the plane, again releasing radioactive material that led to a four-month cleanup mission.

The causes of these two incidents have one thing in common – both resulted from planes carrying nuclear weapons as part of an airborne alert mission.  Although many safeguards were taken due to the high risk of the missions, extremely serious impacts still resulted.  Thus the decision was made to cancel airborne alert missions.  When the risk is too high, sometimes the only solution is to end the situation resulting in the risk.

We can look at these two incidents together in a Cause Map, or visual root cause analysis.  To view the Outlines,  Timeline and Cause Maps in a three-page downloadable PDF, please click “Download PDF” above.  Or click here to read more.

Driver Death at Indy 300

By Kim Smiley

The racing world was filled with sadness with the death of Dan Wheldon during the Indy 300 race in Las Vegas on October 16, 2011.  However, many race-car drivers were not shocked at the occurrence of a 15-car pileup that resulted in Wheldon’s death.  Specifically, these drivers note that the track – which was designed for NASCAR vehicles which travel at much slower speeds – was designed with high banks that allowed cars to accelerate heavily, reaching speeds of up to 225 miles per hour.  This also contributed to the cars remaining very close together, leaving little time or space for drivers to maneuver.  Although the track was smaller in diameter than other tracks (1.5 mile oval compared to the Indy 500’s 2.5 mile oval), it allowed 4 cars to race side by side, as was happening at the time of the crash.

Drivers say that the design of the track, the speed of the cars, and the unusually high number of competitors (34, when a full field is generally 26-28 cars) contributed to the crash.  Also, the open wheel design of Indy cars means that the driver has less control when contacting other cars.  In fact, many drivers said they expected at least one spectacular crash to result, given the circumstances.  Although racecars do have special features that protect drivers in a crash, the cars used in the Indy races have open cockpits, providing less protection.  It also appears that the protective roll hoop was missing on Wheldon’s car, though more information on this has not been released.

Other drivers were also injured in the 15-car pileup, though their injuries were not critical and all others have been released from the hospital.  Wheldon was said to have suffered “unsurvivable head injuries”.   After Wheldon’s death, the race – which had a $5 million prize in hopes to boost ratings – was stopped.   This is the first fatality to occur in Indy racing since 2006.  It is hoped that new safety measures – which Wheldon had been involved with – will continue to make Indy racing safer.  However, there are some drivers that believe that regardless of the safety features in the cars, Indy racing should be done on street courses, not ovals.

To view the Outline and Cause Map, please click “Download PDF” above.

Release of Chemicals at a Manufacturing Facility

By ThinkReliability Staff

A recent issue at a parts plant in Oregon caused a release of hazardous chemicals which resulted in evacuation of the workers and in-home sheltering for neighbors of the plant.  Thanks to these precautions, nobody was injured.  However, attempts to stop the leak lasted for more than a day.  There were many contributors to the incident, which can be considered in a root cause analysis presented as a Cause Map.

To begin a Cause Map, first fill out the outline, containing basic information on the event and impacts to the goals.  Filling out the impacts to the goals is important not only because it provides a basis for the Cause Map, but because goals may have been impacted that are not immediately obvious.  For example, in this case a part was lost.

Once the outline is completed, the analysis (Cause Map) can begin.  Start with the impacts to the goals and ask why questions to complete the Cause Map.  For example, workers were evacuated because of the release of nitrogen dioxide and hydrofluoric acid.  The release occurred because the scrubber system was non-functional and a reaction was occurring that was producing nitrogen dioxide.  The scrubber system had been tripped due to a loss of power at the plant, believed to have been related to switch maintenance previously performed across the street.Normally, the switch could be reset, but the switch was located in a contaminated area that could only be accessed by an electrician – and there were no electricians who were certified to use the necessary protective gear.  The reaction that was producing the nitrogen oxide was caused when a titanium part was dipped into a dilute acid bath as part of the manufacturing process.

When the responders realized they could not reset the scrubber system switch, they decided to lift the part out of the acid bath, removing the reaction that was causing the bulk of the chemicals in the release.  However, the hoist switch was tripped by the same issue that tripped the scrubber system.  Although the switch was accessible, when it was flipped by firefighters, it didn’t reset the hoist, leaving the part in the acid bath, until it completely dissolved.

Although we’ve captured a lot of information in this Cause Map, subsequent investigations into the incident and the response raised some more issues that could be addressed in a one page Cause Map.  The detail provided on a Cause Map should be commensurate with the impacts to the goals.  In this case, although there were no injuries, because of the serious impact on the company’s production goals, as well as the impact to the neighboring community, all avenues for improvement should be explored.

To view the Outline and Cause Map, please click “Download PDF” above.  Or click here to read more.

Deadly E.Coli Outbreak from Sprouts

By Kim Smiley

Since May, at least 31 people have died and nearly 3,000 have been sickened from E.coli infections in Europe in one of the widest spread and deadliest E.coli outbreaks in recent memory.  After days of confusion, German authorities determined that the source of the contamination is sprouts from an organic farm in northern Germany. The farm has suspended sale of produce and won’t reopen until it is determined safe.

This issue can be investigated by creating a Cause Map, an intuitive format for performing a root cause analysis.  In a Cause Map, the causes contributing to an incident are determined and organized by cause-and-effect relationships.  To view a high level Cause Map of this incident, please click on “Download PDF” above.

This investigation is still underway and additional information can easily be added to the Cause Map as it becomes available. The initial source of contamination at the farm had not yet been determined, but sprouts are known have a high risk of carrying dangerous bacteria.

Sprouts are considered to be a high risk food for a number of reasons.  The seeds are often grown in countries with less stringent inspection criteria so they can arrive at growers already contaminated. Seeds can be contaminated in any number of ways.  E. coli live in the gut of mammals so any time animals or animal waste are near sprout seeds there is a chance of contamination.

It can also be difficult to sanitize the seeds.  Bacteria can hide inside damaged seeds and be missed during sanitizing steps.  Sprouts are also grown in warm water, ideal conditions for growing bacteria as well.  Another factor to consider is that many people eat sprouts raw; cooking would kill any bacteria that were present.

Sprouts have been the source of many bacteria outbreaks in the past.  The U.S. has had at least 30 reported outbreaks related to sprouts in the last 15 years.  Sprouts are associated with enough risk that the Food and Drug Administration has issued warnings for those at high risk, (children, the elderly, pregnant women and people with compromised immune systems) to avoid eating raw sprouts.  If you fall into the high risk category or are just feeling nervous after recent events, the easiest way to prevent bacterial infection from sprouts is to cook them.

The Side Effects of Fracking: Explosive Water?

By ThinkReliability Staff

America’s push for clean energy has certainly been a source of intense debate – the safety of off-shore drilling, the hidden costs of ethanol subsidies, even the aesthetics of wind farms.  New evidence is set to increase the intensity on yet another topic – the debate over hydraulic fracturing.

Hydraulic fracturing is a process where internal fluid pressure is used to extend cracks, or fractures, into a rock formation.  It can occur in nature, but in man-made operations fractures are made deep in the earth by pumping fluid (mostly water) and a proppant (such as sand) out the bottom of a well.  The proppant prevents the fracture from closing back up after the injection of fluid stops.  Chemicals are sometimes added to the pumping fluid to aid in the process.  These fractures allow the gas or liquid trapped in the rock formation to flow back through the fracture, up the well and out for production.

More commonly known as “fracking”, the technique is used to release natural gas from shale rock formations.  These formations, especially common on the East Coast and in Canada, have provided thousands of new, well-paying jobs.  Fracking has allowed natural gas companies to access enormous reserves of natural gas, previously thought inaccessible and prohibitively expensive to drill.  In fact fracking has allowed drillers to tap what is potentially the world’s largest known reserve of natural gas in the Marcellus and Utica shale deposits, stretching from New York to Georgia.

As with any new technology however, there are potential consequences.  Lawmakers and regulators have debated the safety of the largely unregulated fracking industry, but with little definitive evidence either way…until now.  A study by Duke University has concluded that fracking does indeed lead to methane contamination in drinking water.  Methane is the primary component in natural gas and is not lethal to consume.  However, high concentrations are explosive.

The study determined that fracking causes methane to leak into drinking water.  Water sources within a kilometer were found to have significant levels of methane, more than 17 times higher than wells located further from drilling sites.  Furthermore, it was determined that the source of the methane was the much older methane released from the bedrock, versus newer methane produced naturally in the environment.

The exact reason for this is unclear, but a Cause Map can lay out the possible areas needing further investigation.  For instance, the frack chemicals might enter the water supply accidentally during the drilling process.  Spills could also contaminate surface water, or chemicals could migrate into the water supply.

The study indicates that chemical migration is most likely what’s happening.  Surface spills, which have happened, are not a major contributor to the wide-spread methane contamination; so that cause can be left in the Cause Map but won’t be investigated further for our purposes.  Furthermore, the study produced no evidence that the drilling process itself was causing the contamination; so that block can be crossed off the Cause Map.

That leaves one possibility – migration.  The chemicals (including methane) could migrate in two different ways – through the well casing or through the bedrock.  The study’s authors felt it was unlikely that chemicals were migrating thousands of feet through bedrock, so migration from well casings experiencing high pressure flow  is more probable.  While more evidence is needed, it is possible that the well casings are weakened by the fracking process which pushes sand through the casings at high pressure.

An EPA study looks to definitively determine fracking’s impact on drinking water, and specifically human health.  However that study is not scheduled to be completed until 2014.  Until then, lawsuits and tighter regulations are likely to dominate headlines.