Tag Archives: root cause analysis

Bluff Collapse Releases Coal Ash

By ThinkReliability  Staff

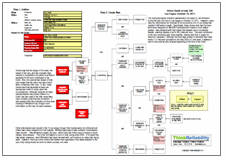
On October 31, 2011, a bluff collapsed at a power plant on the shores of Lake Michigan.  The resulting mudslide took trailers, storage units, at least one truck and an unknown amount of coal ash into the lake, which provides drinking water for more than 40 million people.  Cleanup is ongoing, but the overall impact to the environment has not yet been determined.  Fortunately, no personnel were in the objects that ended up in the lake, so there were no injures.

Although the safety goal was not impacted by this incident, there was the potential for personnel injury.  Additionally, the environmental, customer service, property and labor goals were impacted by the pollution of the lake, loss of property and necessary cleanup.  The causes for these impacts to the goals can be examined in a Cause Map, or visual root cause analysis.

The mudslide which took the objects and coal ash into the lake was caused by insufficient stability of a bluff overlooking the lake.  The bluff’s instability was caused by degraded ground material stability mixed with water and no vegetation.  The vegetation had been removed for construction.  The ground in the area had been filled with coal ash – a practice allowed in previous decades.  Coal ash is less stable than soil, especially when it is exposed to water.  In this case, aerial images suggest that the water seeped into the area from a high water table or from an unlined retention pond used to store storm water.  Although a construction project was ongoing, an environmental impact study – which may have unearthed concerns about the stability of the area – was not considered necessary.

Steps are being taken to clean up the lake to the extent possible.  However, concerns about coal ash in this area and others are prompting a review by Congress to determine how coal ash can be safely dealt with.  Many say this incident suggests that stronger controls are needed.

To view the Outline and Cause Map, please click “Download PDF” above.  Or click here to read more.

BlackBerry’s Widespread Failure

By ThinkReliability Staff

BlackBerry faced yet another setback last month when service went down world-wide for multiple days.  The Research in Motion (RIM) company, already facing stiff competition from other smart phone vendors, apologized profusely for the outage and vowed to woo back its customers.  What caused the extensive and possibly business-ending service outage?

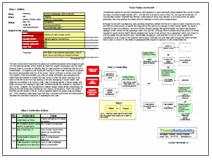
A root cause analysis can help identify what occurred.  The first step is to outline the incident.  The service outage originated in Europe, then spread to four other continents over a 72 hour period.  Customers were furious with the service outage and the slow PR response from the company.  This outage impacted two major RIM goals – to generate revenue for shareholders and maintain customer satisfaction.  Working backwards from these goals, the Cause Map shows what events led to the catastrophic failure and where further investigation is needed.

The company faces a potential loss of revenue if it loses customers.  The company may not have had to worry about the impact of such service outages in the past…except that now there are viable alternatives such as Apple and Android devices.  Continuing to work backwards, customers were upset because of a service outage.  At this point, it helps to examine the BlackBerry network architecture.

BlackBerry’s architecture is fundamentally different from that of Apple and Android.  All data is filtered through the company’s internal service network, before being passed on to carrier networks such as Sprint and Verizon.  Apple and Android don’t provide processing in the middle.  When BlackBerry’s core switch failed in an English data center, a backup switch was supposed to take over.  It had been tested successfully.  Unfortunately the backup didn’t work, leading to a buildup of messages waiting to be processed.  That mountain of messages led to backlogs in other data centers worldwide.  When the switch failed, it also corrupted the database software managing all the messages within the network.  

It turns out that this network architecture is both a liability and at the heart of the company’s business success.  By centrally processing all data messages – both compressing and encrypting them – RIM provides additional security and reduces the processing required at the user device, meaning lower energy use and a longer battery life.  Despite these strengths, RIM would be wise to find out why their network crashed.  As users store more data within the network – as with cloud computing – outages could cripple the system for even longer.

Severe Flooding in Thailand

By ThinkReliability Staff

Thailand is experiencing an unusually heavy monsoon season, but it’s management of the rains that are being blamed for the most severe flooding to occur in the area in decades.  Heavy rains resulting from the monsoon season and high tides are creating serious difficulties for officials in the area, who are having to make hard choices with where to divert water and are essentially “sacrificing” certain towns because there’s nowhere else for the water to go.  One of these decisions ended in a gunfight.  Tensions are high, and people are busying themselves attempting to protect their homes and towns with hundreds of thousands of sandbags.

We can examine the issues contributing to the risk to people and property in a Cause Map, or visual root cause analysis.  First, we define the problem within a problem outline.  In the bottom portion of the outline, we capture the impacts to the country’s goals.  More than 200 people have been reported killed as a result of the floods, which are themselves an impact to the environmental goal.  If citizens can be considered customers, the decision to “sacrifice” some towns to save others can be considered an impact to the customer service goal.  The  property goal is impacted by the destruction of towns and the labor goal is impacted by the flood preparations and rescue missions required to protect the population.

Beginning with these goals and asking “Why” questions, we can diagram the cause-and-effect relationships that contribute to the impacts discussed above.  The decision to “sacrifice” some towns to save others is caused by flooding due to heavy monsoon rains and high tides, and the fact that water had to be directed towards some towns, as there is nowhere else for the water to go.  Towns have been built in catchments and areas designed to be reservoirs. Natural waterways have been dammed and diverted.  Dams are full because insufficient water was discharged earlier in the season due to a miscalculation of water levels. Canals have been filled in or are blocked with garbage.  Insufficient control of development in the area has led to insufficient control of water flow, and lack of areas for water to gather – without endangering towns.

Thailand officials are assisting with sandbags and building new flood barriers and drainage canals.  They’re admitting that this issue needs to be repaired.  According to the director of the National Disaster Warning Center, “If we don’t have integrated water management, we will face this problem again next year.”  Hopefully this is the first step in making changes that ensure loss of life and property is minimized during the annual rainy season.

To view the Outline and Cause Map, please click “Download PDF” above.  Or click here to read more


Driver Death at Indy 300

By Kim Smiley

The racing world was filled with sadness with the death of Dan Wheldon during the Indy 300 race in Las Vegas on October 16, 2011.  However, many race-car drivers were not shocked at the occurrence of a 15-car pileup that resulted in Wheldon’s death.  Specifically, these drivers note that the track – which was designed for NASCAR vehicles which travel at much slower speeds – was designed with high banks that allowed cars to accelerate heavily, reaching speeds of up to 225 miles per hour.  This also contributed to the cars remaining very close together, leaving little time or space for drivers to maneuver.  Although the track was smaller in diameter than other tracks (1.5 mile oval compared to the Indy 500’s 2.5 mile oval), it allowed 4 cars to race side by side, as was happening at the time of the crash.

Drivers say that the design of the track, the speed of the cars, and the unusually high number of competitors (34, when a full field is generally 26-28 cars) contributed to the crash.  Also, the open wheel design of Indy cars means that the driver has less control when contacting other cars.  In fact, many drivers said they expected at least one spectacular crash to result, given the circumstances.  Although racecars do have special features that protect drivers in a crash, the cars used in the Indy races have open cockpits, providing less protection.  It also appears that the protective roll hoop was missing on Wheldon’s car, though more information on this has not been released.

Other drivers were also injured in the 15-car pileup, though their injuries were not critical and all others have been released from the hospital.  Wheldon was said to have suffered “unsurvivable head injuries”.   After Wheldon’s death, the race – which had a $5 million prize in hopes to boost ratings – was stopped.   This is the first fatality to occur in Indy racing since 2006.  It is hoped that new safety measures – which Wheldon had been involved with – will continue to make Indy racing safer.  However, there are some drivers that believe that regardless of the safety features in the cars, Indy racing should be done on street courses, not ovals.

To view the Outline and Cause Map, please click “Download PDF” above.

Toxic Fumes on Aircraft

By ThinkReliability Staff

A settlement against an aircraft manufacturer, with regards to a claim that faulty design allowed toxic fumes to enter the cabin, occurred in early October 2011.  It is the first of its kind to occur in the U.S., but may not be the last.  A documentary entitled “Angel Without Wings” is attempting to bring more attention to the issue, which air safety advocates claim has affected the health and job-readiness of some airline crewmembers.

Although the aircraft manufacturing and operating industries maintain that the air in cabins is safe, breaches are rare, and that the small amount of toxicity that may get into the cabin is not enough to affect human health, the issue is expected to gain more attention, as some industry officials maintain that approximately one flight a day involves leakage of toxic fumes into the passenger cabin of an aircraft.  Although there is debate about the amount of fumes required to cause various health effects, allowing toxic fumes of any amount into a passenger cabin is an impact to both the safety and environment goal.  Additionally, the lawsuit – and the potential of more to come – against the manufacturer is an impact to the customer service goal.  Although the suits have been brought by crew members, there is also a concern for the safety of passengers with respect to exposure to the contaminated air.

The toxic smoke and fumes enter the plane’s air conditioning system when engine air gets into the bleed-air system, which directs air bled from engine compressors into the cabin.  Because there is currently no effective way for crew members to determine that the air is contaminated – no detectors and insufficient training for these crew members to recognize the source and possible outcome of the fumes – the air continues to be fed to the cabin. The creators of the documentary, and other air safety advocates, are requesting that better filters be installed to prevent the toxic fumes to enter the cabin, less toxic oil be used so that the fumes from any leaking oil are less damaging to human health, that detectors be installed in air ducts to notify crew of potential toxicity in the air supply, and better education and training to help crew members identify the potential for exposure to toxic fumes.  However, the manufacturer’s newest design makes all this unnecessary by using an aircraft design that provides air from electric compressors.  Given the length of time that aircraft remain in the air, it will be decades before the system may be phased out.  In the meantime, advocates hope that other corrective actions will be implemented to decrease the potential of exposure to passengers and crew.

To view the Outline and Cause Map, please click “Download PDF” above.  Or click here to read more.

Power Outage Stretches from Arizona to California

By ThinkReliability Staff

On September 8, 2011, work on a fault capacitor in Arizona began a series of events that resulted in the worst power outage in the Southwest for 15 years.  Although there were no injuries reported as a result of the power outage, there was a high potential for injuries and/or deaths, as hospitals shut down and at least one airport lost runway lighting.  Raw sewage leaked onto beaches and millions found themselves without power.  The economic losses from this incident are reported to be as high as $118 million.  The Federal Energy Regulatory Commission (FERC) will be conducting an investigation to determine how simple capacitor work resulted in an incident with such extreme effects.

The issues related to this power outage are complicated, and can be more clearly understood in a visual format, such as a Cause Map.  We can examine the cause-and-effect relationships that resulted in the impacted goals discussed above.  The potential for injury was caused by a loss of electrical power to hospitals and airports.   The loss of power was caused by a grid crash, resulting from insufficient power and high demand (at least partially due to a heat wave).  Power stations that normally provide electricity were automatically shut down when a current reverse (normally the current runs from Arizona to California) resulted from the loss of a transmission line resulting from the capacitor work.  Although “operator error” has been mentioned as a potential cause, it’s undesirable that one operator’s error could cause such an extreme power outage.  The system should be designed to prevent this, and the investigation will hopefully address issues in the system that contributed to the extent of the outage.

In addition to losing power stations, insufficient base-load capacity in the area (long a source of concern) meant that standby plants could not be brought up fast enough to prevent the crashing of the grid.  Also, renewable wind and solar energy sources weren’t much help due to less than ideal weather conditions for production (cloudy with low wind).

The FERC’s investigation will determine causes that contributed to this power outage and will provide recommendations to limit these types of incidents in the future.  Specifically, they will determine what allowed a simple capacitor issue to result in an extensive power outage and will also consider the grid stability in the area.  However, in the meantime, some individual businesses discovered a boon in having their own generators.  Additionally, U.S. Navy ships in port in San Diego used their generators to supply power to the grid.  While these actions certainly helped lessen the effect of the outage (and brought in a lot of business to locations that did have generators), broader improvements are needed to prevent these types of issues in the future.

To view the Outline and Cause Map, please click “Download PDF” above.

International Space Station Supply Ship Crash

By ThinkReliability Staff

On August 24, 2011, a supply ship heading to the International Space Station (ISS) crashed in Siberia, losing two tons of cargo.  However, the impact of this loss was much more than the two tons of cargo – it may lead to an evacuation of the ISS, which would become unmanned for some unknown period of time.

The crash of the unmanned Progress 44 supply ship, which was on its way to resupply the ISS, was caused by the emergency deactivation of the Soyuz rocket when a gas generator malfunctioned.   Until the specific causes of the malfunction are determined, manned Soyuz flights are grounded.  That means that a new crew cannot get to the Space Station to relieve the current crew.  Although the current crew has enough supplies for the time being, they cannot remain on the space station past December.  The spacecraft already at the station (their “guaranteed ride home”) are only allowed in space for 200 days – due to limited battery life and concern for degradation of rubberized seals from contact with thruster fuel.

Because of a lack of funding, American shuttles are now all mothballed, leaving the Russian Soyuz rockets the  only way to and from the space station.  Finding another way to get there by December is unlikely, leaving the attempt to determine and fix the problems with Soyuz the only hope for continued manning of the ISS.

We can examine this incident in a Cause Map, beginning with the impacts to the goals.  For example, although there were no safety goal impacts resulting from the crash of the unmanned ship, the customer service goal is impacted due to the potential of evacuating the ISS.  The production goal is impacted because of the grounding of manned Soyuz flights, and the property goal is impacted due to the two tons of lost cargo meant for the space station.  We begin our Cause Map with these impacts to the goals, asking “Why” questions to complete the analysis.  The amount of detail in the map is determined by the impact to the goals.  Because the crash may lead to the evacuation and continued unmanned operation of the space shuttle, once specific causes are determined, this Cause Map would become quite detailed.  For now, because the causes have not yet been determined, we begin with a simple map, which does capture the impacts to the goals and the basic information now known.

To view the Outline and Cause Map, please click “Download PDF” above.

Release of Chemicals at a Manufacturing Facility

By ThinkReliability Staff

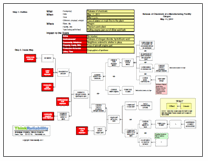
A recent issue at a parts plant in Oregon caused a release of hazardous chemicals which resulted in evacuation of the workers and in-home sheltering for neighbors of the plant.  Thanks to these precautions, nobody was injured.  However, attempts to stop the leak lasted for more than a day.  There were many contributors to the incident, which can be considered in a root cause analysis presented as a Cause Map.

To begin a Cause Map, first fill out the outline, containing basic information on the event and impacts to the goals.  Filling out the impacts to the goals is important not only because it provides a basis for the Cause Map, but because goals may have been impacted that are not immediately obvious.  For example, in this case a part was lost.

Once the outline is completed, the analysis (Cause Map) can begin.  Start with the impacts to the goals and ask why questions to complete the Cause Map.  For example, workers were evacuated because of the release of nitrogen dioxide and hydrofluoric acid.  The release occurred because the scrubber system was non-functional and a reaction was occurring that was producing nitrogen dioxide.  The scrubber system had been tripped due to a loss of power at the plant, believed to have been related to switch maintenance previously performed across the street.Normally, the switch could be reset, but the switch was located in a contaminated area that could only be accessed by an electrician – and there were no electricians who were certified to use the necessary protective gear.  The reaction that was producing the nitrogen oxide was caused when a titanium part was dipped into a dilute acid bath as part of the manufacturing process.

When the responders realized they could not reset the scrubber system switch, they decided to lift the part out of the acid bath, removing the reaction that was causing the bulk of the chemicals in the release.  However, the hoist switch was tripped by the same issue that tripped the scrubber system.  Although the switch was accessible, when it was flipped by firefighters, it didn’t reset the hoist, leaving the part in the acid bath, until it completely dissolved.

Although we’ve captured a lot of information in this Cause Map, subsequent investigations into the incident and the response raised some more issues that could be addressed in a one page Cause Map.  The detail provided on a Cause Map should be commensurate with the impacts to the goals.  In this case, although there were no injuries, because of the serious impact on the company’s production goals, as well as the impact to the neighboring community, all avenues for improvement should be explored.

To view the Outline and Cause Map, please click “Download PDF” above.  Or click here to read more.

Greece Economic Woes – Part 2

By ThinkReliability Staff

In our previous blog about Greece’s economic woes, we looked at some of the impacts the recent events have had on Greece and potentially the rest of the European Union (EU) and a timeline of the events that are part of the ongoing economic crisis.  However, we stopped short of an analysis of what contributed to these impacts.

The outline, which we filled out previously, discusses an event or incident with respect to impacts to the goals of a country (economy, company, etc.).  An analysis of the causes of these impacts can be made using a Cause Map, or visual root cause analysis.  To do so, begin with one impacted goal and ask “why” questions to complete the analysis.  For example, Greece’s financial goal is impacted because its debt rating is just above default.  Why? Because the ratings agencies were concerned with Greece’s ability to repay.  Why? Because their debt to revenue ratio is too high.

Whenever you encounter a situation where a ratio is too high – such as this case, where debt is too high compared to revenue – it means that the Cause Map will have two branches.  Each part of the ratio is a branch.  In this case, if debt to revenue is too high, it means that debt is too high and revenue is too low.  Each branch can be explored in turn.  There have been cases made that only one or the other branch is important, but what we’re looking for in a Cause Map is solutions that can help ameliorate the problem.   Due to the severity of the issue in Greece, solutions that reduce debt and solutions that increase revenue must both be implemented in order to attempt to repair the financial standing.

Greece’s government debt is high – caused by government spending on borrowed money when the euro was strong and interest rates were low.  There are many parts to government spending, which can make their own Cause Map.  Suffice to say, reducing government spending – by a lot – is necessary to reduce the debt to revenue ratio.  Unfortunately, severe reductions in government spending also mean reductions in government services, and government salaries.  As an example, government workers, which total 25% of the total workforce, are seeing their pay reduced 10%.  As you can imagine, this reduced spending has angered some Greeks, causing riots, which have killed Greek citizens.  In this case, the solution “reduced spending” also becomes a cause in another branch of the Cause Map.  It’s important to remember that not all solutions are free of consequences and that solutions themselves may contribute to the overall problems.

Greece’s revenue is insufficient to fuel their current spending levels.   Tax revenue is decreased by tax evasion, high unemployment, and a shrinking economy.  The Cause Map isn’t simple here either, because the shrinking economy contributes to the unemployment rate, and decreased spending can result in decreased revenue.  The worldwide economic woes are contributing to the shrinking economy, but also low levels of foreign investment, caused by what is considered a difficult place to do business due to political, legal, and cultural issues.  Last but not least, many governments in Greece’s situation would devalue their currency in order to regain an economic edge.  However, Greece uses the Euro – so devaluing currency isn’t an option.  There has been some talk of Greece dropping the Euro but a bailout by the other EU countries (itself an impact to the goals) appears to have shelved that discussion for now.

In addition to reduced tax revenue, Greece is having trouble borrowing money.  As their credit rating has fallen (it now has the lowest credit rating in the world), interest rates for loans are climbing, so it is possible that Greece will still fall into bankruptcy and loans will not be repaid. This is caused by the debt to revenue ratio, and adds a circular reference to our map.  This is why the economic issue has been described as a spiral – the causes feed into each other, making it difficult to climb out.

However, Greece has made admirable strides to attempt to reduce their debt and increase their revenue.  Only time will tell if that, and the bailout from the EU, will be enough.
Train Crash in China Kills 39

By Kim Smiley

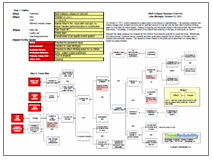
It is rare for the conduct of the investigation to be one of the biggest headlines in the week following an accident, but this has been the case after a recent train crash in China.  On July 23, 2011, two trains collided in Wenzhou, China, killing 39 and sending another 192 people to the hospital.

What appears to have happened is that a train moving at speed rear ended another train that had stalled on the tracks. It was announced that the first train had stalled after a lightning strike.  Soon after the accident, people reported seeing the damaged train cars broken apart by back hoes and buried.  Meaning the evidence was literally being buried without ever having been thoroughly examined.  The Chinese government stated that the cars contained “State-level” technology and were being buried to keep it safe.

The internet frenzy and public outrage fueled by how this investigation was handled was impressive. According to a recent New York Times article, 26 million messages about the tragedy have been posted on China’s popular twitter-like microblogs.  So powerful has the public outrage been that the first car from the oncoming train has been dug up and sent to Wenzhou for analysis.

More information  on the technical reasons for the train crash is slowly coming to light.  Five days after the accident, government officials have stated that a signal which would have stopped the moving train failed to turn red and the error wasn’t noticed by workers.  There is talk about system design errors and inadequate training.

It’s unlikely that all the details will ever be public knowledge, but there is one takeaway from this accident that can be applied to any organization in any industry that performs investigations – the importance of transparency. The Chinese government spent over $100 billion in 2010 expanding the high speed rail system, but if people don’t feel safe riding the rail system it won’t be money well spent.  Customers need to feel that an adequate investigation has been performed following an accident or they won’t use the products produced by the company.

To view an initial Cause Map built for this train accident, please click on “Download PDF” above.  A Cause Map is an intuitive, visual method of performing a root cause analysis.  One of the benefits of a Cause Map is that it’s easily understood and can help improve the transparency of an investigation for all involved.