Tag Archives: Investigation

“Ghost Train” Causes Head-On Collision in Chicago

By Kim Smiley

On September 30, 2013, an unoccupied train collided head on with another train sending 30 people to the hospital in Chicago.  In a nod to the season and the bizarre circumstances of the accident, the unoccupied train has been colorfully dubbed “the ghost train”. 

So what caused the “ghost train” and how did it end up causing a dangerous train collision?  Investigators from the National Transportation Safety Board (NTSB) are still reviewing the details of the accident, but some information is available.  An initial Cause Map, or visual root cause analysis, can be built to capture what is already known and can be expanded to incorporate more information as the investigation progresses.  A Cause Map is built by asking “why” questions and documenting the answers to visually lay out all the causes that contributed to an accident to show the cause-and-effect relationships from left to right.

In this example, the trains collided because an unoccupied train began moving and the safety systems in place did not stop the train.  Investigators still haven’t determined exactly what caused the train cars to move, but a key piece of the puzzle is that there was still power to the cars while they were being stored in a repair terminal awaiting maintenance.  The NTSB believes that it was common practice to leave power to cars so that the lights could be used to illuminate the terminal.  Workers used the lights to discourage graffiti and vandalism because the terminal was located in a high crime neighborhood. 

Investigators will need to not only determine why the train started rolling, but also learn more about why the safety systems didn’t prevent the accident.  Before colliding with another train, the unoccupied train traveled through five mechanical train-stop mechanisms, each of which should have stopped a train without a driver.  Emergency brakes were applied at each train-stop that caused the train to pause momentarily, but then it started moving because the setting on the master lever caused the train to restart.  Review of the safety systems will need to be part of the investigation to ensure that adequate protection is in place to prevent anything similar from occurring again.

The NTSB investigation is still ongoing, but the NTSB has stated that de-energizing propulsion power and using an alternate brake setting could help prevent unintended movement of unoccupied train cars. Additionally, the NTSB believes the use of a wheel chock and/or derail would ensure that a train stopped by a mechanical train stop mechanism remains stopped.  Based on the information already uncovered, the NTSB has issued an urgent safety recommendation to the Federal Transit Authority (FTA). The NTSB recommended that the FTA issue a safety advisory to all rail transit properties to review procedures for storing unoccupied train cars to ensure that they were left in a safe condition that wouldn’t allow unintended movement and to ensure that they had redundant means of stopping any unintended movement.  There is more information that is needed to fully understand this accident, but these precautions would be effective solutions that can be quickly implemented to reduce the risk of train accidents.

NYT Website Disrupted for Hours

By Kim Smiley

On Tuesday, August 27, 2013 the New York Times website went dark for several hours after being attacked by a well-known group of hackers.   Reports of hacked websites are becoming increasingly common and the New York Times was just one of many recent victims.

A Cause Map, or visual root cause analysis, can be used to analyze the recent attack on the New York Times website.  A Cause Map lays out the many causes that contribute to an issue in an intuitive format that illustrates the cause-and-effect relationships.   A Cause Map is useful for understanding all the causes involved and can help when brainstorming solutions.  To see a Cause Map of this example, click on “Download PDF” above.

Some details of how the attack was done have been released, as documented on the Cause Map. The New York Times website itself was not technically hacked, but traffic was redirected away from the legitimate website to another web domain.   To pull off this feat, hackers changed the domain name records for the New York Times website after acquiring the user name and password of an employee at the domain name registrar company.  The employee inadvertently provided the information to the hackers by responding to a phishing email asking for personal information.

The email sent by the hackers looked legitimate enough to fool the employee.

So why did hackers target the New York Times in the first place?  The answer is that the New York Times is one of many western media outlets to be targeted by Syrian Electronic Army (S.E.A.), who has claimed responsibility for the attack.  The S.E.A. supports President Bashar al-Assad of Syria and is generally unhappy with the way the events in Syria have been portrayed in the West.

So the next logical question is how do you protect yourself from a phishing scheme?  The first step is awareness.  Pretty much everybody who uses email can expect to receive some suspicious emails.  A few things to look out for:  attachments, links, misspellings, and a mismatched “from” field or subject line.  Also any alarming language should be a red flag.  For example, an email from your credit card company warning you that your account will be closed unless you take immediate action is probably not the real deal.  A good rule of thumb is to never respond to any email with personal information or to click on links in emails. If you think a request for action may be real, either call the company or open a new web browser window and type in the company’s web address.  It’s best to delete any suspicious emails immediately.

This example is also a good reminder to be aware that websites can get hacked.  A great example of this is when the S.E.A. hacked the Associated Press’s twitter feed last April and used it to announce (falsely) that the White House had been bombed.  That one tweet is estimated to have caused a $136 billion loss in the stock markets as people responded to the news.  In general, it is probably good to be skeptical about anything shocking you read online until the information is confirmed.

What Happens When a Copy Isn’t a Copy?

By Kim Smiley

Think of how many documents are scanned every day. Imagine how important some of these pieces of paper are, such as invoices, property records, and medical files. Now try to picture what might happen if the copies of these documents aren’t true copies. This is exactly the scenario that Xerox was recently facing.

It recently came to light that some copies of scanned documents were altered by the scanning process. Specifically, some scanner/copier machines changed numbers on documents. This issue can be analyzed by building a Cause Map, an intuitive, visual format for performing a root cause analysis. The first step in the Cause Mapping process is to fill in an Outline with the basic background information on an issue. Additionally, the impacts to the overall goals are documented on the Outline to help clarify the severity of any given issue. In this example, the customer service goal is impacted because the scanners weren’t operating as expected. There is also a potential impact to the overall economic goal because the altered documents could result in any number of issues. There is also an impact because of the labor needed to investigate and fix the problem.

After completing the Outline, the next step is ask “why” questions to build the Cause Map. Why weren’t the scanners operating as expected? This happened because the scanners were changing some documents during the scanning process. Scanners use software to help interpret the original documents and Xerox has stated that the problem happened because of a software bug. Testing showed that the number substitutions were more likely to occur when the settings on the scanners were set to lower quality/ higher compression because of the specific software used for these settings. Testing also showed that the error was more likely to occur when scanning those documents that were more difficult to read such as those with small fonts or that had already been copied multiple times.

Xerox had been aware of the potential for number substitution at lower quality settings, but didn’t appear to expect it to occur at factory settings (which was found to be very unlikely, but possible). A notice that stated that character substitutions were possible appeared on the scanners when lower resolution settings were selected and was included in some manuals, but this approach seems to have been ineffective since many users were caught unaware by this issue.

After a Cause Map has been built with enough detail to understand the issue, it can be used to help develop solutions. In this example, Xerox developed a software patch that corrected the error. Xerox also posted several blogs on their website to keep customers informed about the issue and worked with users to ensure that the patch was successful in correcting the error.

To see a high level Cause Map of this issue, click on “Download PDF” above.


Deadly Plane Crash at San Francisco Airport

By Kim Smiley

On July 6, 2013, Asiana Airlines Flight 214 crashed while attempting to land at the San Francisco International Airport. Three people have died as a result of the crash and around 180 others were injured, 13 critically. The cause of the crash is currently under investigation, but there were no obvious mechanical issues and the weather was near perfect.

Even though the investigation is still in its infancy, an initial Cause Map can be built to document what is known now about the accident and it can easily be expanded later as more information becomes available. A Cause Map is a visual format for performing a root cause analysis that intuitively lays out the different causes for an accident. The first step in the Cause Mapping process is to fill in an Outline with the basic background information for an issue. On the bottom half of the Outline there is space to document how the problem impacts the overall goals. This is useful because it helps everyone involved in the process understand the big picture and the issues with the more significant impacts can be prioritized first.

There is also space on the Outline to list anything that was different or unusual at the time the problem occurred. It’s important to note any differences because they are usually worth exploring during an investigation because they may have played a role in the accident. In this specific example, this was the first time the pilots had worked together and the two main pilots were both in unfamiliar roles. The pilot landing the plane had limited experience with Boeing 777s even though he was an experienced pilot and this was his first time landing this type of aircraft at the San Francisco airport. There was another pilot instructing him, but it was his first flight as an instructor.

Once the Outline is completed, the next step is to ask “why” question and add the answers to the Cause Map. In this example, we know that the airplane was coming in too low and too slow to land safely, but it isn’t known why that happened. The NTSB has initiated an investigation and the results will reported when the analysis is complete. Some of the early speculation is that there may have been an equipment failure, mismanagement of automated systems or ineffective communication in the cockpit. The fact that this crew was different than the typical staffing has been a focus of investigators, but it isn’t known what role they may have played in the crash.

Another piece of this puzzle is that one of the passengers who died at the crash scene appears to have been killed when she was run over by a fire engine. She was covered in foam on the ground and the firefighters were unaware of her location. Emergency response procedures will need to be reviewed as part of the investigation into this accident to ensure that first responders can do their jobs in the safest way possible.

To view an initial Cause Map of this issue, click on “Download PDF” above.


Hindenburg Crash: The Importance – and Difficulty – of Validating Evidence

By ThinkReliability Staff

Since the Hindenburg explosion in 1937, theories have abounded on what caused the leaking gas and spark that doomed the airship and dozens of passengers.  We discussed some of these theories in our previous blog on the Hindenburg disaster.

In December, 2012, a documentary on the Discovery Channel used new evidence to discuss the most likely cause of the disaster.  Yep, that’s right.  76 years after the original explosion, evidence is still being gathered to help determine what really caused the explosion that killed 36 people.

Sometimes evidence is relatively easy to gather – many pieces of equipment now feed into automatic data collectors, which can provide reams of data about what happened for a specific period of time.  Sometimes, however, evidence is much harder to come by. This is especially the case with fires or explosions which frequently destroy much of the available evidence.

When evidence is hard to come by, it is difficult to determine the exact cause-and-effect relationships that led to an incident.  The best we may be able to do is capture different possibilities in a Cause Map, or visual root cause analysis, and leave the causes that haven’t been validated by evidence as possible causes, indicated by a question mark.

Sometimes, determining the exact cause(s) is important enough to result in painstaking efforts like those performed by a team at the South West Research Institute.  The team created three 1/10-scale models, not a small undertaking when the scale models are over 80 feet in length and is inflated with 200 cubic meters of hydrogen.  They then replicated scenarios described by the various theories by setting fire to, and blowing up, the models.  Additionally, they studied archive footage and eyewitness accounts to increase their understanding of the disaster.

As a result, the team now believes they have determined what happened.  Says Jem Stansfield, an aeronautical engineer and the project lead, “I think the most likely mechanism for providing the spark is electrostatic.”   The spark ignited leaking hydrogen, caused by a broken tensioning wire that punctured a gas cell or a sticking gas valve.

View the updated investigation with the recently released evidence incorporated by clicking “Download PDF” above.

Read our detailed writeup on the Hindenburg investigation.

Or, click here to read more from the blog of the on-air historian and technical advisor to the project (some really cool photos of making and destroying the models are included).

The Comet That Couldn’t Fly

By ThinkReliability Staff

“… the most exhaustively tested airplane in history.”

-Expert opinion on the DeHavilland Comet

Today, commercial jet air travel is standard fare. Estimates for the amount of air traffic over the United States in a given day have been in the range of 87,000 flights. With clever planning, clear skies and smooth service, a citizen almost anywhere in the world can get anywhere else by plane in less than 24 hours. But looking back at the history of aviation show us how far safety has come. Consider the DeHavilland Comet, the first commercial jet to reach production. British aviation specialists finalized the Comet’s design with much excitement in 1945 in hopes it would position their industry to establish a revolutionary service in commercial jet flight. Unfortunately, the Comet crashed on January 10th and April 8th in 1954.

What happened? We can identify some of the causes in a Cause Map, or visual root cause analysis.

CAUSE #1: POOR TESTING When you test an extremely heavy object carrying hundreds of people at high speeds thousands of feet above the ground, you would think planning for the worst case scenario would make the most sense. Unfortunately, the Comet tests were performed in tainted conditions on the strongest part of the plane.

Add in the fact that there was no prototype for the plane and you’ve got a test not worth having… and a plane not worth flying.

CAUSE #2: UNEXPECTED PRESSURE Altitude leads to pressure, and pressure puts stress on planes. But this stress wasn’t evenly distributed, and certain parts of the planes’ bodies were unevenly affected. So rather than the expected amount of pressure on the planes, the Comets faced an unforeseen squeeze.  

CAUSE #3: FLYING ABOVE AND BEYOND The Comet flew at twice the speed, height and cabin pressure of any previous aircraft, displaying a rather dangerous amount of ambition.

Combine all of this, Cause Map it, and you’ve got a plane flying under incredible conditions it couldn’t withstand, facing high pressure where it was most vulnerable.

In other words, an airborne recipe for disaster.

FALLOUT #1) SAFETY As expected, the pressure cycle in the planes’ cabins cracked the bodies of the planes. When the planes broke up, the lives of 56 passengers and crew members were lost.

#2) CUSTOMER SERVICE Some British industry institutions have a highly prestigious reputation (the Royal Navy’s impact on British sea travel comes to mind). The loss of the aircraft, though, was a black eye on British Aviation. Aviation historian George Bibel called the Comet an “adventurous step forward and a supreme tragedy.”

#3) MATERIALS/LABOR Effective airplanes have never been cheap, and this was no different. Not only would it cost money to investigate the cause of the accidents, but to replace the airplanes.   

FUTURE SOLUTION The Comet’s tragic crash had one silver lining: the post-crash analysis performed by its designers (including Sir Geoffrey de Havilland) set the precedent for future air accident investigations. In fact, the Comet was redesigned to solve the issues that caused the crashes and would later fly successfully. But by then, Boeing had already taken over most of the commercial jet market.

In the end, the Comet was first in flight but last in the market.

See more aviation cause maps:

Want us to cause map a specific plane crash for you? Tell us in the comments and we’ll pilot our way through it.

11 Year Old Flies to Rome from England without Ticket or Passport

By Kim Smiley

On July 25, 2012, an 11 year old boy managed to sneak aboard a flight to Rome from Manchester England without a ticket or a passport.  No one noted the presence of the extra passenger until other passengers informed airline staff that the boy had told them he was running away from home and seemed suspicious.  The timing of this incident was unfortunate since it occurred a few days before the start of the Olympics and raised more questions about British security.

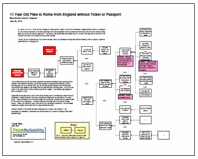
How did a boy manage to depart on an aircraft without any of the proper documentation?  This incident can be analyzed by building a Cause Map, a visual root cause analysis which intuitively shows the relationships between the causes that contributed to the issue.

In this example, the boy was able to sneak onto the flight because the extra passenger wasn’t noted in the head count and he got through five separate security checks.  The boy did not circumvent any of the normal security checks, he just walked through them without showing a shred of paper or anybody questioning him or stopping him.

The boy was able to get into the secure departure area without showing a ticket, get through the passport check without a passport, get through security screening without showing a ticket or boarding pass (he did go through the x-ray), get through the gate passport and boarding pass check without any paperwork and finally board the plane without a boarding pass.  Add in the final failure of the head count to notice an extra body and an English 11 year without any paperwork was on his way to Rome.

Apparently the boy was able to pull off this feat by sticking close to families with children and took advantage of situations where one family member was showing the documentation for a large group.   Video surveillance from the airport shows him acting very confident and his behavior gave no one reason to be suspicious.  The airport was also very busy due to the summer holiday season. Throw in an ineffective head count and the end result was a significant, if not particularly dangerous, security breach days before a huge international event.

Several members of the airline staff were suspended as a result of this incident.  A full investigation is underway to understand the incident and work to ensure something similar never happens again.

To view a high level Cause Map of this incident, click on “Download PDF” above.

Several Incidents at CA Nuclear Plant Raise Concerns

By Kim Smiley

Within a week, three separate incidents occurred at the San Onofre Nuclear Generating Station, located near heavily populated areas, raising new concerns about the safety of the nuclear power plant.

This issue can be investigated by building a Cause Map, an intuitive, visual root cause analysis.  The first step in building a Cause Map is to determine what goals are impacted by the issue being considered.  In this case, the main goal being considered is safety.  If the Cause Map was being built from the perspective of the power plant company, then the production and schedule impacts would also need to be considered, but in this example we will focus on the safety impacts.

The safety goal is impacted because some people are concerned about the safety of the power plant because it is near heavily populated areas and three separate incidents occurred within days of each other.  The three incidents in question were the release of a small amount of radiation, discovery of unexpected amounts of wear on steam generator tubes, and the potential contamination of a worker.

A small amount of radiation was released because a steam generator tube, which carries radioactive water, was leaking.  Luckily, the leak was small and the plant was quickly shut down after the leak was discovered so no significant amounts of radiation were released.  A second reactor unit is currently shut down for maintenance and inspection of the steam generator tubes found significantly more wear than expected on some of the tubes.  The wear was unexpected because the tubes have only been in service for 22 months and two tubes had 30% wall thinning, 69 tubes had 20% wall thinning and 800 had 10% wall thinning.  The situation is being investigated, but neither the cause of the wear nor the best course of action has not yet been determined.  The final incident was the potential contamination of a worker because he fell into a reactor pool.  According to media reports, the worker was trying to retrieve a flash light and lost his footing.

To view a high level Cause Map of this incident, click “Download PDF” above.  The Cause Map can be expanded as more information comes available so that it can document and illustrate as much detail as needed to evaluate the issues.

As it stands, both the reactor units with the steam generator tubes are shut down.  The unit that experienced the leak is shutdown pending investigation and any necessary repairs.  The second unit that had the unexpected wall thinning in the steam generator tubes is in a planned shutdown of several months while it is refueled and upgraded.  The plants will be brought back online once it’s determined safe to do so.

Toxic Fumes on Aircraft

By ThinkReliability Staff

A settlement against an aircraft manufacturer, with regards to a claim that faulty design allowed toxic fumes to enter the cabin, occurred in early October 2011.  It is the first of its kind to occur in the U.S., but may not be the last.  A documentary entitled “Angel Without Wings” is attempting to bring more attention to the issue, which air safety advocates claim has affected the health and job-readiness of some airline crewmembers.

Although the aircraft manufacturing and operating industries maintain that the air in cabins is safe, breaches are rare, and that the small amount of toxicity that may get into the cabin is not enough to affect human health, the issue is expected to gain more attention, as some industry officials maintain that approximately one flight a day involves leakage of toxic fumes into the passenger cabin of an aircraft.  Although there is debate about the amount of fumes required to cause various health effects, allowing toxic fumes of any amount into a passenger cabin is an impact to both the safety and environment goal.  Additionally, the lawsuit – and the potential of more to come – against the manufacturer is an impact to the customer service goal.  Although the suits have been brought by crew members, there is also a concern for the safety of passengers with respect to exposure to the contaminated air.

The toxic smoke and fumes enter the plane’s air conditioning system when engine air gets into the bleed-air system, which directs air bled from engine compressors into the cabin.  Because there is currently no effective way for crew members to determine that the air is contaminated – no detectors and insufficient training for these crew members to recognize the source and possible outcome of the fumes – the air continues to be fed to the cabin. The creators of the documentary, and other air safety advocates, are requesting that better filters be installed to prevent the toxic fumes to enter the cabin, less toxic oil be used so that the fumes from any leaking oil are less damaging to human health, that detectors be installed in air ducts to notify crew of potential toxicity in the air supply, and better education and training to help crew members identify the potential for exposure to toxic fumes.  However, the manufacturer’s newest design makes all this unnecessary by using an aircraft design that provides air from electric compressors.  Given the length of time that aircraft remain in the air, it will be decades before the system may be phased out.  In the meantime, advocates hope that other corrective actions will be implemented to decrease the potential of exposure to passengers and crew.

To view the Outline and Cause Map, please click “Download PDF” above.  Or click here to read more.

1982 Tylenol Tampering

By ThinkReliability Staff

In 1982, 31 million bottles of Tylenol were recalled after seven deaths from cyanide poisoning.  After an investigation, higher than lethal doses of cyanide were found to have been inserted into bottles of Extra-Strength Tylenol capsules in retail stores in the Chicago area. Tylenol’s manufacturer, Johnson & Johnson, immediately took action and recalled all Tylenol products.

Although the reason for the poisoning is unclear – the suspect has still not been caught, though interest in the case has recently been revived – what was clear is that the ability to tamper with a product in such a malicious way without the tampering being evident contributed to the deaths.  As a result of this issue, capsules (which are much easier to insert foreign objects into than solid pills) decreased in use, and tamper-evident packaging became used for many products.

Although the manufacturing and packaging process were not implicated in the poisonings (the adulterated packages were from different plants, but all came from stores within the Chicago area), there was concern that Tylenol would never again be popularly accepted.  However, Johnson and Johnson’s quick and effective action in the immediate recall of all products and public relations campaigns to urge people not to use products until the issue had been resolved has been considered a playbook on how to conduct an effective recall and is believed to have directly contributed to the resurgence in the popularity of Tylenol shortly after the issue.  (See “How Effective Public Relations Saved Johnson and Johnson“.)

Even though this case hasn’t been resolved, and the killer still remains unknown, it is possible to examine the issue with a Cause Map.  Because this case has stretched over many years, a timeline can help to sort through information.  The outline contains the many impacts to the goals related to the issue, and the Cause Map sorts through causes – both “good” and “bad” – related to the issue.  Solutions implemented to decrease the ability to tamper with consumer products are also noted.