Tag Archives: fatalities

School Leveled by Gas Explosion

By Kim Smiley

On March 18, 1937, the London School of New London, Texas was leveled by a huge explosion.  Unfortunately, many people were in the school on the afternoon of the explosion and an estimated 280 students, 15 teachers, 2 visitors and a school secretary were killed.  This tragedy remains the worst catastrophe to occur inside a school in American history.

The cause of this tragic incident can be investigated by building a Cause Map, a visual root cause analysis, which shows the cause and effect relationships between the different factors that contributed to the explosion.  A Cause Map begins by determining which goals were impacted and in this example the safety goal is the obvious focus.  Causes are then added to the Cause Map by asking “why” questions to add additional information.  In this example, the safety goal was impacted by the large number of fatalities.  The deaths occurred because the school was occupied and the school was destroyed.
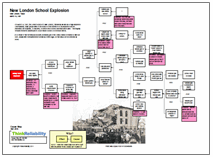
The school was destroyed because there was a large natural gas explosion.  The explosion occurred because there was a large quantity of natural gas in the school and a shop teacher turned on a sander and created a spark.  The gas was in the school because there was a leak, there was a large quantity of gas was trapped in a void space under the school and the gas leak wasn’t detected.  The investigation into this incident was never able to decisively determine what caused the natural gas leak.  The void space was under the school because the school was built on a slope.  The leak wasn’t detected because the school was using untreated natural gas which is both invisible and odorless.

Why was the school using untreated natural gas?  The school was trying to save money by eliminating their heating bill.  The school was located near oil fields and had tapped into a nearby residue gas line to provide heat, saving approximately $300 dollars a month.  Using free untreated natural gas was a common practice in the region.  The gas company turned a blind eye since natural gas was considered a waste product of oil drilling that was just flared off.

The end result of using free, but untreated natural gas was that no one could detect that the school was filled with natural gas.  One spark and the whole school was destroyed along with many, many lives.

As a result of this horrendous accident, all natural gas in the United States is treated to have an odor, usually with mercaptan which smells like rotten eggs, so that leaks can be detected by smell.

Honduran Prison Fire

By ThinkReliability Staff

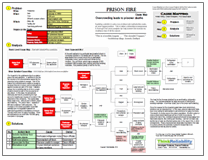
How do you know when your solutions haven’t been effective?  When the same problem keeps happening.  Another prison fire claimed 360 lives in Honduras.  This is the third fatal prison fire in nine years, resulting from  chronic overcrowding and understaffing of Honduran jails.

Just more than 3 years since over 100 prisoners were killed in a prison fire  in San Pedro Sula (see previous blog), 360 prisoners (so far) have died as a result of a fire in Comayagua Prison.  (A fire in 2003 claimed the lives of 68 prisoners.)  An open flame has been determined to be the cause of the fire but contributing to the deaths is that the prisoners were unable to get out.

With any incident resulting in deaths of this magnitude, we can analyze the causes of the incident using a visual root cause analysis, or Cause Map.  We begin with the impacts to the goals.  In this case, the prisoner deaths were an impact to the safety goal.  In addition, prison overcrowding can be considered an impact to the production goal, and a delay in rescue can be considered an impact to the customer service.  Any damage resulting to the prison itself as  a result of the fire is an impact to the property goal.  Once we’ve determined the goals that were impacted, we can begin the analysis by asking “why” questions.

An investigation determined that an open flame (such as a cigarette or candle) and not arson, as was suggested prior to the investigation, caused the fire.  However, severe overcrowding (more than 800 prisoners were in a jail with a capacity of 500) and a delay in the rescue of the prisoners contributed to the massive death toll.

Honduras has a chronic overcrowding problem.  Honduras has a high rate of homicides and a high number of gang members.  Gang members receive strict sentences and, in many cases, are jailed prior to conviction.  However, an increased number of  inmates has not led to an increased number of guards.  On the night of the fire, there were 6 guards on duty.  Guards who were in the towers were not allowed to leave their posts to help with the fire-fighting and rescue efforts.  The guard who had the only set of keys fled prior to unlocking the doors.  (The guards are facing disciplinary actions.)  Firefighters were not allowed to enter the jail for 30 minutes after the fire call as the guards believed they were experiencing a riot or breakout.  An inmate who was not in his cell at the time of the fire was able to free many prisoners.

This incident has added more fuel to the international outcry over the state of Honduras prisons.   However, not much appears to have been done to improve conditions since the previous fires in 2003 and 2009, so it’s unclear if anything will change as a result of this fire.   It is certainly apparent that the safety of prisoners cannot be maintained with the current overcrowding and number of guards.  Additionally, procedures in the case of a fire certainly need to be improved to ensure that prisoners can be evacuated safely and securely.

To view the Outline and Cause Map, please click “Download PDF” above.

Prison Fire Kills 103 in 2009

By Staff

On February 9, 2009, a fire and explosion in a seriously overcrowded prison in Honduras resulted in 103 deaths and 25 injuries.  The fire was started from a short circuit from a overheated refrigerator motor, used to store soft drinks for the inmates.  The cell block – which has a capacity of 800 – contained 1960 inmates, their clothing, and their bedding materials.  This provided plenty of fuel for the fire.

We can look at the causes that led to the prisoner deaths in a Cause Map, or visual root cause analysis.  We begin with the impacts to the goals.  The deaths and injuries of prisoners are an impact to the safety goal.  The environmental goal was impacted by the severe prison fire and explosion.  The customer service goal (considering the general population as the “customer” of a government-run prison) was unaffected, as there were no prisoner escapes.  Finally, the property goal was impacted due to damage to the prison.

We can continue the Cause Map by asking “why” questions.  The impacts to the goals were due to a severe prison fire and explosion.  In addition to the fire, the injuries to the prisoners was caused by the prisoners being unable to escape.  Part of the reason the prisoners were unable to escape is because they are in prison, and so precautions against escape are part of the deal.  However, egress from a building that is on fire to a safe location should be part of the procedures of any prison.  In this case, the procedures obviously didn’t work considering the high amount of deaths and injuries (of a total of 186 prisoners in this cell block).  The egress was likely made more   difficult due to severe prison overcrowding.  The prison has a capacity of 800 and contained 1,960 prisoners.  The increase in the prison population is at least partially due to a legislation passed the previous August which mandated a minimum 12-year prison term for gang members.  There are estimated to be more than 100,000 gang members in Honduras.

The heat for the fire was provided by an overheating refrigerator motor.  The fuel was provided by large amounts of clothing and bedding materials – more than usual, due to the prison overcrowding.

Once the causes for the impacted goals have been determined, solutions can be brainstormed.  In this case, prisoner advocates have been long calling for alternatives to jail sentences for gang members.  This would, of course, reduce the prison population.  Another option to reduce prison overcrowding would be to build more prisons.  To reduce the risk of fire, motorized equipment should be kept away from flammable objects, like clothing and bedding.  Last but not least, any facility has to have an effective egress plan in the case of fire or other emergencies.  These procedures are especially important in the case of a prison, where the potential of prisoner escape has to be considered as well as prisoner safety.

To view the root cause analysis investigation, please click “Download PDF” above.  Or click here to read more.

1960 Plane Collision over NYC killed 134

By ThinkReliability Staff

On December 16, 1960, two planes collided about a mile above Brooklyn, New York.  One plane – United Airlines Flight 826 – was in a holding pattern preparing to descend into Idlewild (now John F. Kennedy International) Airport.  The other plane – TWA Flight 266 – was preparing to descend into LaGuardia.  Since both airports serve New York City, they are in fairly close proximity.  The planes, too, were in close proximity – too close, leading to their collision.  In addition to the 84 passengers killed on the United flight (though one would survive for a day) and the 44 passengers killed on the TWA flight, 6 people were killed in the neighborhood of Park Slope, where the United plane landed.

This incident can be outlined in a Cause Map or visual root cause analysis.  We begin with determining the impacted goals.  First, the 134 total deaths were an impact to the safety goal.  The United flight crash resulted in a fire that affected more than 200 buildings, an impact to both the environmental and property goal.   The liability for the crash was assigned to both airlines and the government, an impact to the customer service goal.  There was another impact to the property goal because both planes were destroyed.  Lastly, the labor goal was impacted due to the rescue efforts of the more than 2,500 personnel who responded to the two crash sites.

These impacts to the goals occurred when both planes crashed after colliding.  The planes collided after their flight paths brought them into too close of proximity.  The United flight was estimated to be 12 miles outside its holding  pattern when the crash occurred, possibly because the ground beacon was not working.  The controllers at Idlewild were unaware of the plane’s position as planes were not tracked in holding patterns as it was too difficult to identify individual planes.  The planes were unaware of each other.  The visibility was extremely poor due to foggy, cloudy, sleety and snowy weather.  The United plane had lost the ability to use their instruments due to a loss of a receiver.  (The cause is unknown.)  Additionally, the controllers at LaGuardia (who were guiding in the TWA flight) were unable to reach the TWA plane to warn them of the close proximity of the United plane.

Although comprehensive details are not known about the crash, much of the information used to put together the investigation was obtained from the flight recorder (or “black box”).  This is now a main source of data in aviation accident investigations.  The evidence in this case was used to divide up liability for the accident very exactly – 61% to United Airlines, 24% to the US government and the remainder to TWA.

To view the Outline and Cause Map, please click “Download PDF” above.

Fatal Cruise Ship Accident

By ThinkReliability Staff

At least 11 people have been killed – with 24 still missing – after the cruise ship Costa Concordia ran aground on rocks near the island of Giglio, Italy.  The ship was taken  manually up to 4 miles off course on a route not  authorized by the company.

This incident can be thoroughly examined in a visual root cause analysis built as a Cause Map.  First, we examine the impacts to the goals for this incident.  The confirmed deaths and missing people are a significant impact to the safety goal.   Additionally, the environmental goal is impacted because of the potential for a spill of the 500,000 gallons of fuel still onboard.  The required evacuation of the ship can be considered a customer impact goal.  The loss of use of the ship – estimated to be $85 to $95 million for lost usage in the next year and the decrease in bookings due to concern over the incident can be considered an impact to the production/schedule goal.  The damage to the ship, which was recently built and insured for approximately $575 million, is an impact to the property goal and the rescue and recovery efforts are an impact to the labor goal.

Once we have these impacts to the goals, we can begin an analysis by asking “why” questions.  The impact to the safety goal – dead and missing passengers and crew – were caused by the ship running aground on rocks and  some issues with the evacuation process.  The ship ran aground on rocks because it got too close to the island in a manually programmed unauthorized deviation of the ship’s route, potentially to provide passengers with a better view.  This deviation in route, sometimes called a “fly by”, had been previously authorized by the company.  No crew members questioned the change in route by the Captain, noting that onboard he is solely responsible for the ship.  (Note that with great power comes great responsibility, and the Captain has been charged with manslaughter.)   Although the ship contains alarms meant to warn the crew when the ship goes off-course, these alarms are deactivated when the ship route is manually altered.

There were some issues with the evacuation of the ship, though as the company notes, not due to the evacuation procedure, which was externally reviewed in November.  Rather the issues were caused by the severe list of the ship (it was leaning almost completely to one side), which affects the ability to use the lifeboats.  Additionally, some of the passengers (who had just come aboard) had not yet completed a lifeboat drill.  The drill is required to be performed within 24 hours of boarding the ship and was scheduled for the morning after departure. The grounding occurred just 3.5 hours after departure.

Currently, rescue and recovery efforts continue.  Attempts are being made to remove fuel from the ship, which is in a protected area.  Concern about cruise ships in the area have previously been raised, with some wanting to limit ships that are allowed in the area.  Additionally, both the cruise ship company and the government are reconsidering the timing of lifeboat drills in order to ensure the best results for passengers in issues like these.

To view the Root Cause Analysis investigation, please click “Download PDF” above

Severe Flooding in Thailand

By ThinkReliability Staff

Thailand is experiencing an unusually heavy monsoon season, but it’s management of the rains that are being blamed for the most severe flooding to occur in the area in decades.  Heavy rains resulting from the monsoon season and high tides are creating serious difficulties for officials in the area, who are having to make hard choices with where to divert water and are essentially “sacrificing” certain towns because there’s nowhere else for the water to go.  One of these decisions ended in a gunfight.  Tensions are high, and people are busying themselves attempting to protect their homes and towns with hundreds of thousands of sandbags.

We can examine the issues contributing to the risk to people and property in a Cause Map, or visual root cause analysis.  First, we define the problem within a problem outline.  In the bottom portion of the outline, we capture the impacts to the country’s goals.  More than 200 people have been reported killed as a result of the floods, which are themselves an impact to the environmental goal.  If citizens can be considered customers, the decision to “sacrifice” some towns to save others can be considered an impact to the customer service goal.  The  property goal is impacted by the destruction of towns and the labor goal is impacted by the flood preparations and rescue missions required to protect the population.

Beginning with these goals and asking “Why” questions, we can diagram the cause-and-effect relationships that contribute to the impacts discussed above.  The decision to “sacrifice” some towns to save others is caused by flooding due to heavy monsoon rains and high tides, and the fact that water had to be directed towards some towns, as there is nowhere else for the water to go.  Towns have been built in catchments and areas designed to be reservoirs. Natural waterways have been dammed and diverted.  Dams are full because insufficient water was discharged earlier in the season due to a miscalculation of water levels. Canals have been filled in or are blocked with garbage.  Insufficient control of development in the area has led to insufficient control of water flow, and lack of areas for water to gather – without endangering towns.

Thailand officials are assisting with sandbags and building new flood barriers and drainage canals.  They’re admitting that this issue needs to be repaired.  According to the director of the National Disaster Warning Center, “If we don’t have integrated water management, we will face this problem again next year.”  Hopefully this is the first step in making changes that ensure loss of life and property is minimized during the annual rainy season.

To view the Outline and Cause Map, please click “Download PDF” above.  Or click here to read more


1982 Tylenol Tampering

By ThinkReliability Staff

In 1982, 31 million bottles of Tylenol were recalled after seven deaths from cyanide poisoning.  After an investigation, higher than lethal doses of cyanide were found to have been inserted into bottles of Extra-Strength Tylenol capsules in retail stores in the Chicago area. Tylenol’s manufacturer, Johnson & Johnson, immediately took action and recalled all Tylenol products.

Although the reason for the poisoning is unclear – the suspect has still not been caught, though interest in the case has recently been revived – what was clear is that the ability to tamper with a product in such a malicious way without the tampering being evident contributed to the deaths.  As a result of this issue, capsules (which are much easier to insert foreign objects into than solid pills) decreased in use, and tamper-evident packaging became used for many products.

Although the manufacturing and packaging process were not implicated in the poisonings (the adulterated packages were from different plants, but all came from stores within the Chicago area), there was concern that Tylenol would never again be popularly accepted.  However, Johnson and Johnson’s quick and effective action in the immediate recall of all products and public relations campaigns to urge people not to use products until the issue had been resolved has been considered a playbook on how to conduct an effective recall and is believed to have directly contributed to the resurgence in the popularity of Tylenol shortly after the issue.  (See “How Effective Public Relations Saved Johnson and Johnson“.)

Even though this case hasn’t been resolved, and the killer still remains unknown, it is possible to examine the issue with a Cause Map.  Because this case has stretched over many years, a timeline can help to sort through information.  The outline contains the many impacts to the goals related to the issue, and the Cause Map sorts through causes – both “good” and “bad” – related to the issue.  Solutions implemented to decrease the ability to tamper with consumer products are also noted.

Crash Causes Deaths at Air Race

By ThinkReliability Staff

Sad news is nothing new for the National Championship Air Races – there have been 29 deaths associated with the races in its 47-year history.  However, the ten deaths and dozens of injuries (some extremely serious) resulting from a plane crash and explosion on September 16, 2011 have brought attention to the safety of air racing.

Although full details of the causes of the crash and explosion have not been determined by the National Transportation Safety Board, we can begin a comprehensive root cause analysis with the information available so far by building a Cause Map.  First, we capture the basic details (such as the date and time of the incident) in the Outline.  Then we record the impacts to the goals.  In this case, there was a significant impact to the safety goal, considering the high number of deaths and significant injuries.  The customer service goal can be considered to be impacted because the spectators at the show were not sufficiently protected from injury.  (The FAA grants approval to air shows based on safety of the spectators from a crash.)   The remaining days of the race were cancelled – an impact to the schedule goal.  The plane was destroyed, an impact to the property goal, and the resulting NTSB investigation will cause an impact to the labor goal because of the resources required to complete the investigation.

Once we have captured these impacts to the goals, we can use them to begin the analysis.  The injuries and deaths occurred from the plane crashing into the VIP section and the subsequent explosion which resulted in shrapnel injuries.  The pilot lost control of the plane and did not have sufficient time to recover (as evidenced by there being no indication that he made a distress call).  It’s unclear what exactly caused the loss of control; however, the plane had been modified to increase its speed, which would have impacted its stability in flight.  Additionally, photos taken just before the crash appear to indicate that a portion of the tail fell off, but the reason why has not yet been discovered.  What happened to the tail section, and how the modifications affected control of the plane, are questions the NTSB will examine in their report.

Because of the goal of an air race – traveling around a course at low altitudes and high speeds – it’s no surprise that the pilot did not have sufficient time to recover control before crashing.  Given that these conditions are expected during air races – and appear to be an acceptable risk to pilots, who continue to race even with the high number of crashes and fatalities that result – it appears that there needs to be more consideration of how spectators are protected from crashes and the shrapnel that can result from the destruction of a plane.

When more evidence is gathered, more information can be added to  the Cause Map.  Once that occurs, the NTSB can examine the causes contributing to the deaths at the air race, and make recommendations on how future deaths can be avoided.

To view the Outline and Cause Map, please click “Download PDF” above.