Tag Archives: Cause Mapping

Toxic Fumes on Aircraft

By ThinkReliability Staff

A settlement against an aircraft manufacturer, with regards to a claim that faulty design allowed toxic fumes to enter the cabin, occurred in early October 2011.  It is the first of its kind to occur in the U.S., but may not be the last.  A documentary entitled “Angel Without Wings” is attempting to bring more attention to the issue, which air safety advocates claim has affected the health and job-readiness of some airline crewmembers.

Although the aircraft manufacturing and operating industries maintain that the air in cabins is safe, breaches are rare, and that the small amount of toxicity that may get into the cabin is not enough to affect human health, the issue is expected to gain more attention, as some industry officials maintain that approximately one flight a day involves leakage of toxic fumes into the passenger cabin of an aircraft.  Although there is debate about the amount of fumes required to cause various health effects, allowing toxic fumes of any amount into a passenger cabin is an impact to both the safety and environment goal.  Additionally, the lawsuit – and the potential of more to come – against the manufacturer is an impact to the customer service goal.  Although the suits have been brought by crew members, there is also a concern for the safety of passengers with respect to exposure to the contaminated air.
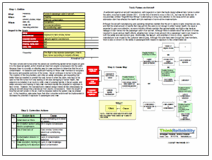
The toxic smoke and fumes enter the plane’s air conditioning system when engine air gets into the bleed-air system, which directs air bled from engine compressors into the cabin.  Because there is currently no effective way for crew members to determine that the air is contaminated – no detectors and insufficient training for these crew members to recognize the source and possible outcome of the fumes – the air continues to be fed to the cabin. The creators of the documentary, and other air safety advocates, are requesting that better filters be installed to prevent the toxic fumes to enter the cabin, less toxic oil be used so that the fumes from any leaking oil are less damaging to human health, that detectors be installed in air ducts to notify crew of potential toxicity in the air supply, and better education and training to help crew members identify the potential for exposure to toxic fumes.  However, the manufacturer’s newest design makes all this unnecessary by using an aircraft design that provides air from electric compressors.  Given the length of time that aircraft remain in the air, it will be decades before the system may be phased out.  In the meantime, advocates hope that other corrective actions will be implemented to decrease the potential of exposure to passengers and crew.

To view the Outline and Cause Map, please click “Download PDF” above.  Or click here to read more.

1982 Tylenol Tampering

By ThinkReliability Staff

In 1982, 31 million bottles of Tylenol were recalled after seven deaths from cyanide poisoning.  After an investigation, higher than lethal doses of cyanide were found to have been inserted into bottles of Extra-Strength Tylenol capsules in retail stores in the Chicago area. Tylenol’s manufacturer, Johnson & Johnson, immediately took action and recalled all Tylenol products.

Although the reason for the poisoning is unclear – the suspect has still not been caught, though interest in the case has recently been revived – what was clear is that the ability to tamper with a product in such a malicious way without the tampering being evident contributed to the deaths.  As a result of this issue, capsules (which are much easier to insert foreign objects into than solid pills) decreased in use, and tamper-evident packaging became used for many products.

Although the manufacturing and packaging process were not implicated in the poisonings (the adulterated packages were from different plants, but all came from stores within the Chicago area), there was concern that Tylenol would never again be popularly accepted.  However, Johnson and Johnson’s quick and effective action in the immediate recall of all products and public relations campaigns to urge people not to use products until the issue had been resolved has been considered a playbook on how to conduct an effective recall and is believed to have directly contributed to the resurgence in the popularity of Tylenol shortly after the issue.  (See “How Effective Public Relations Saved Johnson and Johnson“.)

Even though this case hasn’t been resolved, and the killer still remains unknown, it is possible to examine the issue with a Cause Map.  Because this case has stretched over many years, a timeline can help to sort through information.  The outline contains the many impacts to the goals related to the issue, and the Cause Map sorts through causes – both “good” and “bad” – related to the issue.  Solutions implemented to decrease the ability to tamper with consumer products are also noted.

Crash Causes Deaths at Air Race

By ThinkReliability Staff

Sad news is nothing new for the National Championship Air Races – there have been 29 deaths associated with the races in its 47-year history.  However, the ten deaths and dozens of injuries (some extremely serious) resulting from a plane crash and explosion on September 16, 2011 have brought attention to the safety of air racing.

Although full details of the causes of the crash and explosion have not been determined by the National Transportation Safety Board, we can begin a comprehensive root cause analysis with the information available so far by building a Cause Map.  First, we capture the basic details (such as the date and time of the incident) in the Outline.  Then we record the impacts to the goals.  In this case, there was a significant impact to the safety goal, considering the high number of deaths and significant injuries.  The customer service goal can be considered to be impacted because the spectators at the show were not sufficiently protected from injury.  (The FAA grants approval to air shows based on safety of the spectators from a crash.)   The remaining days of the race were cancelled – an impact to the schedule goal.  The plane was destroyed, an impact to the property goal, and the resulting NTSB investigation will cause an impact to the labor goal because of the resources required to complete the investigation.

Once we have captured these impacts to the goals, we can use them to begin the analysis.  The injuries and deaths occurred from the plane crashing into the VIP section and the subsequent explosion which resulted in shrapnel injuries.  The pilot lost control of the plane and did not have sufficient time to recover (as evidenced by there being no indication that he made a distress call).  It’s unclear what exactly caused the loss of control; however, the plane had been modified to increase its speed, which would have impacted its stability in flight.  Additionally, photos taken just before the crash appear to indicate that a portion of the tail fell off, but the reason why has not yet been discovered.  What happened to the tail section, and how the modifications affected control of the plane, are questions the NTSB will examine in their report.

Because of the goal of an air race – traveling around a course at low altitudes and high speeds – it’s no surprise that the pilot did not have sufficient time to recover control before crashing.  Given that these conditions are expected during air races – and appear to be an acceptable risk to pilots, who continue to race even with the high number of crashes and fatalities that result – it appears that there needs to be more consideration of how spectators are protected from crashes and the shrapnel that can result from the destruction of a plane.

When more evidence is gathered, more information can be added to  the Cause Map.  Once that occurs, the NTSB can examine the causes contributing to the deaths at the air race, and make recommendations on how future deaths can be avoided.

To view the Outline and Cause Map, please click “Download PDF” above.

Explosion at Nuclear Waste Site Kills One

By Kim Smiley

An explosion at a nuclear waste processing site in France killed one and injured four workers on September 12, 2011.  The investigation is still ongoing, but it is still possible to create a Cause Map, a visual root cause analysis, that contains all known information on the incident.  As more information becomes available, the Cause Map can easily be expanded to incorporate all relevant details.  One advantage of Cause Mapping is that it can be used to document all information at each step of the investigation process in an intuitive way, in a single location.

When the word “nuclear” is involved emotions and fears can run high, especially following the recent events at the Fukushima nuclear plant in Japan.  This incident is a good example where providing clear information can help calm the situation.  The explosion in France happened when a furnace used to burn nuclear waste failed.  The cause of the explosion itself isn’t known at this time, but there is some relevant background information available that helps explains the potential ramifications of the explosion.

The key to understanding the impact of this incident is the type of nuclear waste that was being burned.  According to statements by the French government, the furnace involved was only used to burn waste with very low level contamination.  It burned things such as gloves and overalls as well as metal waste like tools and pumps.  No objects that were part of a reactor were treated in the furnace.  There are also no reactors at the site that could be potentially damaged by explosion.

There was no radiation leakage detected and the potential for large amounts of released radiation wasn’t there based on the type of material being processed.  It was a horrible accident that resulted in a death and severe injuries, but there was no risk to public health.

How France views nuclear power is also a bit of background worth knowing.  France is the world’s most nuclear power dependent country.  Fifty-eight reactors generate nearly three fourths of France’s power.  France is also a major exporter of nuclear technology.  The public relations issues associated with a nuclear disaster in France would be very complicated.

Once the investigation into this incident is complete, solutions can complete be determined and implemented to help prevent any future occurrences.

Spill Kills Hundreds of Thousands of Marine Animals

By ThinkReliability Staff

A recent fish kill is estimated to have killed hundreds of thousands of marine life – fish, mollusks, and even endangered turtles – and the company responsible is facing lawsuits from nearby residents and businesses affected by the spill causing the kill.  A paper mill experienced problems with its wastewater treatment facility (the problems have not been described in the media), resulting in the untreated waste, known as “black liquor”, being dumped in the river.  The waste has been described as being “biological” not chemical in nature; however, the waste reduced the oxygen levels in the river which resulted in the kill.

Although it’s likely that a spill of any duration would have resulted in some marine life deaths, the large number of deaths in this case are related to the length of time of the spill.  It has been reported that the spill went on for four days before action was taken, or the state was notified.  The company involved says that action, and reporting to the state, are based on test results which take several days.

Obviously, something needs to be changed so that the company involved is able to determine that a spill is occurring before four days have passed.  However, whatever actions will be taken are as of yet unclear.  The plant will not be allowed to reopen until it meets certain conditions meant to protect the river.  Presumably one of those conditions will be figuring out a method to more quickly discover, mitigate, and report problems with the wastewater treatment facility.

In the meantime, the state has increased discharge from a nearby reservoir, which is raising the water levels in the river and improving the oxygen levels.  The company is assisting in the cleanup, which has involved removing lots of stinky dead fish from the river.  The cleanup will continue, and the river will be stocked with fish, to attempt to return the area to its conditions prior to the spill.

This incident can be recorded in a Cause Map, or a visual root cause analysis.  Basic information about the incident, as well as the impact to the organization’s goals, are captured in a Problem Outline.  The impacts to the goals (such as the environment goal was impacted due to the large numbers of marine life killed) are used to begin the Cause Map.  Then, by asking “Why” questions, causes can be added to the right.  As with any incident, the level of detail is dependent on the impact to the goals.

To view the Outline and Cause Map, click “Download PDF” above.

Release of Chemicals at a Manufacturing Facility

By ThinkReliability Staff

A recent issue at a parts plant in Oregon caused a release of hazardous chemicals which resulted in evacuation of the workers and in-home sheltering for neighbors of the plant.  Thanks to these precautions, nobody was injured.  However, attempts to stop the leak lasted for more than a day.  There were many contributors to the incident, which can be considered in a root cause analysis presented as a Cause Map.

To begin a Cause Map, first fill out the outline, containing basic information on the event and impacts to the goals.  Filling out the impacts to the goals is important not only because it provides a basis for the Cause Map, but because goals may have been impacted that are not immediately obvious.  For example, in this case a part was lost.

Once the outline is completed, the analysis (Cause Map) can begin.  Start with the impacts to the goals and ask why questions to complete the Cause Map.  For example, workers were evacuated because of the release of nitrogen dioxide and hydrofluoric acid.  The release occurred because the scrubber system was non-functional and a reaction was occurring that was producing nitrogen dioxide.  The scrubber system had been tripped due to a loss of power at the plant, believed to have been related to switch maintenance previously performed across the street.Normally, the switch could be reset, but the switch was located in a contaminated area that could only be accessed by an electrician – and there were no electricians who were certified to use the necessary protective gear.  The reaction that was producing the nitrogen oxide was caused when a titanium part was dipped into a dilute acid bath as part of the manufacturing process.

When the responders realized they could not reset the scrubber system switch, they decided to lift the part out of the acid bath, removing the reaction that was causing the bulk of the chemicals in the release.  However, the hoist switch was tripped by the same issue that tripped the scrubber system.  Although the switch was accessible, when it was flipped by firefighters, it didn’t reset the hoist, leaving the part in the acid bath, until it completely dissolved.

Although we’ve captured a lot of information in this Cause Map, subsequent investigations into the incident and the response raised some more issues that could be addressed in a one page Cause Map.  The detail provided on a Cause Map should be commensurate with the impacts to the goals.  In this case, although there were no injuries, because of the serious impact on the company’s production goals, as well as the impact to the neighboring community, all avenues for improvement should be explored.

To view the Outline and Cause Map, please click “Download PDF” above.  Or click here to read more.

Rioting in England

By ThinkReliability Staff

Rioting is a defined as a violent, public disorder caused by a group of persons.  It is a unique phenomenon in that it is difficult to pinpoint exactly what is going to trigger and sustain a riot.  Social scientists know that there is a tipping point at which participants no longer fear punishment (such as jail) as the number of gatherers increases.  However there are many common contributing factors.  A Cause Map can help sort out what led to this month’s rioting over in the United Kingdom.

It began on August 4th, following the police shooting of a 29-year old in North London.  The police claimed he was suspected of weapons possession and were attempting to execute a warrant.  During the arrest, the suspect was shot and killed.  However, questions arose regarding the circumstances of the arrest and family and friends came to believe that the victim, Mark Duggan, was unarmed.  This led to a peaceful protest of approximately 120, ending at the police station in Tottenham, North London.  Protestors demanded answers, and police officials seemed unable to satisfy the crowd.

The crowd lingered while police stalled, and grew as disgruntled local youths began to arrive at dusk.  At this point, things began to spiral out of control.  Why did this unsatisfied, but otherwise quiet gathering turn into a multi-day riot across an entire country?

According to social scientists, rioting generally occurs when there are certain elements present.  Normally there have to be a lot of people.  There also needs to be a low level of perceived risk that they will be punished for unacceptable behavior.  This perception generally increases as there are fewer law enforcement officers and also as there are more people.  Those people generally are upset about something.  There also needs to be a feeling that others are likely to join in.  But even with all these elements, a riot will not start.  The final element is a “catalyst”.  This is typically a person who has calculated that the risk of being targeted by law enforcement is sufficiently low, and acts out – such a throwing a rock through a window.

Examining the Cause Map reveals that these elements were present in the initial riot as well as in the general rioting that broke out across the country.  It becomes evident that the rioting was cyclical – the initial riot led to more widespread rioting.  And the same elements that were present in the initial riot were present in the widespread rioting as well.

After completing the Cause Map analysis, the next step is to determine how to prevent this from happening again.  Everyone seems to have an opinion on what went wrong, and more importantly what needs to be done differently to prevent such costly and dangerous behavior.  Resorting back to the Cause Map, we can look for opportunities to prevent future riots.  Some of the elements that contribute to a riot can be controlled more easily than others.  For instance it is easier to limit mass gatherings than control the emotions of a crowd.  Hence, greater police presence and an ability to clear the street – through curfew or quick arrests – are usually the best solutions for limiting riots.  A table of proposed solutions completes the analysis.

Greece Economic Woes – Part 2

By ThinkReliability Staff

In our previous blog about Greece’s economic woes, we looked at some of the impacts the recent events have had on Greece and potentially the rest of the European Union (EU) and a timeline of the events that are part of the ongoing economic crisis.  However, we stopped short of an analysis of what contributed to these impacts.

The outline, which we filled out previously, discusses an event or incident with respect to impacts to the goals of a country (economy, company, etc.).  An analysis of the causes of these impacts can be made using a Cause Map, or visual root cause analysis.  To do so, begin with one impacted goal and ask “why” questions to complete the analysis.  For example, Greece’s financial goal is impacted because its debt rating is just above default.  Why? Because the ratings agencies were concerned with Greece’s ability to repay.  Why? Because their debt to revenue ratio is too high.

Whenever you encounter a situation where a ratio is too high – such as this case, where debt is too high compared to revenue – it means that the Cause Map will have two branches.  Each part of the ratio is a branch.  In this case, if debt to revenue is too high, it means that debt is too high and revenue is too low.  Each branch can be explored in turn.  There have been cases made that only one or the other branch is important, but what we’re looking for in a Cause Map is solutions that can help ameliorate the problem.   Due to the severity of the issue in Greece, solutions that reduce debt and solutions that increase revenue must both be implemented in order to attempt to repair the financial standing.

Greece’s government debt is high – caused by government spending on borrowed money when the euro was strong and interest rates were low.  There are many parts to government spending, which can make their own Cause Map.  Suffice to say, reducing government spending – by a lot – is necessary to reduce the debt to revenue ratio.  Unfortunately, severe reductions in government spending also mean reductions in government services, and government salaries.  As an example, government workers, which total 25% of the total workforce, are seeing their pay reduced 10%.  As you can imagine, this reduced spending has angered some Greeks, causing riots, which have killed Greek citizens.  In this case, the solution “reduced spending” also becomes a cause in another branch of the Cause Map.  It’s important to remember that not all solutions are free of consequences and that solutions themselves may contribute to the overall problems.

Greece’s revenue is insufficient to fuel their current spending levels.   Tax revenue is decreased by tax evasion, high unemployment, and a shrinking economy.  The Cause Map isn’t simple here either, because the shrinking economy contributes to the unemployment rate, and decreased spending can result in decreased revenue.  The worldwide economic woes are contributing to the shrinking economy, but also low levels of foreign investment, caused by what is considered a difficult place to do business due to political, legal, and cultural issues.  Last but not least, many governments in Greece’s situation would devalue their currency in order to regain an economic edge.  However, Greece uses the Euro – so devaluing currency isn’t an option.  There has been some talk of Greece dropping the Euro but a bailout by the other EU countries (itself an impact to the goals) appears to have shelved that discussion for now.

In addition to reduced tax revenue, Greece is having trouble borrowing money.  As their credit rating has fallen (it now has the lowest credit rating in the world), interest rates for loans are climbing, so it is possible that Greece will still fall into bankruptcy and loans will not be repaid. This is caused by the debt to revenue ratio, and adds a circular reference to our map.  This is why the economic issue has been described as a spiral – the causes feed into each other, making it difficult to climb out.

However, Greece has made admirable strides to attempt to reduce their debt and increase their revenue.  Only time will tell if that, and the bailout from the EU, will be enough.

Greece Economic Woes – Part 1

By ThinkReliability Staff

Greece is currently suffering from an economic crisis.  Leaders in Greece, the European Union, and the rest of the world are all anxiously watching as events unfold to attempt to minimize the impact of these issues.  An analysis of this issue can help these leaders minimize their own impacts, as well as provide appropriate aid to Greece.  However, performing an root cause analysis on an issue whose roots reach back years is not an easy task.

Normally a root cause analysis performed as a Cause Map begins with a problem outline.  However, sometimes an issue is so complicated that it’s difficult to begin there.  In these kinds of cases, beginning with the creation of a timeline may aid in the investigation.

What to include in the timeline is a frequently asked question.  When beginning a timeline, put in all the information you have.  It may make sense to go back later and create a less detailed timeline.  However, many events that don’t initially seem to add much to the timeline may later turn out to be important in the analysis.  In the case of Greece, I began the timeline with Greece’s entry into the European Union (EU).  While it wasn’t clear initially whether this contributed to the current issues being faced by Greece, it later became clear that the restrictions placed on EU-member countries did in fact contribute to the current issues.

Events in the timeline may turn out to be impacted goals.  For example, at various points in the timeline Greece’s credit rating has been downgraded.  The last downgrade occurred just before default by Moody’s.  Having a solid credit rating is an important goal – so a downgraded credit rating, especially one as low as Greece’s, is an impact to the financial goal of that country.

Once the timeline has begun (it’s not really complete until the issue is considered resolved, which in this case will take years), the next step would be to tackle the outline.  Writing the timeline will hopefully have provided some clarity to the issue.  For example, since Greece entered recession in 2009, we can choose 2009-2011 as a logical time to enter in the outline.  If more detail is desired, referring to the timeline is also appropriate.

The most commonly asked question about the outline is what to write in the “differences” row.  Differences are meant to capture things that may have been out of the ordinary, or potentially answer the question “why this country (or equipment or time) as opposed to some other country?”  Because Greece is a part of the European Union, which has consistent financial goals for its members, we can use some data points that show how Greece differs from other countries in the EU, or essentially answer the question “why is Greece having these issues instead of the other EU countries?”  In Greece, debt is estimated to be 150% of the Gross Domestic Product (GDP).  This is much higher than for most other nations.  The public sector in Greece accounts for about 40% of the GDP, also higher than typical.  Greece has the second lowest Index of Economic Freedom in the EU, which impacts its ability to quickly adjust to economic changes.   Greece economic statistics were (significantly)   misreported, contributing to the rapid decline in stability.  And, Greek tax evasion is estimated at 13B Euros a year.  This is likely not a full list of the differences between Greece and other EU countries, but it’s a start  and the outline can continue to evolve as more information is provided on the issue.

Once the top portion of the outline is complete, the impacts to the goals can be addressed.  Again, many of these impacts can be pulled from the timeline.  There were some citizen deaths associated with rioting as a result of proposed economic policies, which is an impact to the safety goal.  Spending cuts and tax increases impact the customer service goal (in this case, the “customers” are the citizens of Greece).  The production goal is impacted because of high (above 16%) unemployment, and the financial goals are impacted by a debt rating just above default and a 110B euro default.  Last but not least, there is the potential for impact on the European Union if the crisis spreads beyond Greece.

As you’ve noticed, no real analysis has yet taken place.  We’ll look at some of the causes contributing to the      current issues in Greece in an upcoming blog.  Click on “Download PDF” above to view the timeline and outline

Foreclosures Down?

By ThinkReliability Staff

At first glance, it might appear to be a welcome story.  After years of decline in the housing market, there has been a significant dip in foreclosure filing rates.  However the real reason behind the dip isn’t economic recovery…it’s a backlog of work at banks across the nation.  A visual Cause Map helps illuminate what is really going on.

Foreclosure filings have dropped 25% in the last six months of 2010.  This normally would mean that fewer properties require foreclosure.  Banks usually notify homeowners within days of the first missed payment.  After multiple missed payments, the Notice of Default is finally sent to the homeowner, about 2 months after the initial missed payment. If the homeowner doesn’t pay up, that’s followed soon after by a foreclosure filing.  In most states, eviction can happen in as little as 120 days.

However in today’s economy, banks are slower to take on new foreclosures.  One of the major causes – a huge backlog of vacant properties – has made banks reluctant to notify newly delinquent homeowners.  The initial notification process has slowed down, but so has the entire foreclosure process.  Banks hope that by delaying the process, homeowners may be able to resume payment – the preferred outcome.  In some states, foreclosures are averaging well over 900 days.  Banks are in the business of managing money, not property.

There’s another reason behind the processing delays.  Last fall banks were brought to court for robo-signing, a practice where law firms were automatically signing off on all foreclosure paperwork.  The practice meant that many applicants were illegally kicked out of their homes.  Many of the largest banks and lenders suspended processing to determine how robo-signing was occurring and stop it.  It turns out that law firms, in an effort to get through the mountains of paperwork, were rubberstamping the foreclosure filings without due diligence to ensure everything was in order.

Delayed foreclosures are beneficial to families facing eviction, however often it is simply delaying the inevitable.  Many economists believe that the economy will continue to struggle until the housing market recovers.  In the meantime, the foreclosure crisis will drag on until banks can close out these dysfunctional loans.