Tag Archives: Cause Mapping

Radioactive Release in the 1960s due to Inadvertent Dropping of Nuclear Weapons

By ThinkReliability Staff

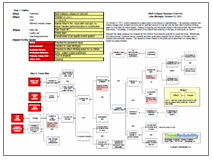
In the history of nuclear weapons in the U.S., two accidents (or inadvertent drops) of nuclear weapons have resulted in widespread dispersal of nuclear materials.  These two incidents occurred two years apart, within a week.  The incidents had many similarities: in both cases, a B-52 bomber carrying nuclear weapons was damaged in air during an airborne alert mission and released nuclear weapons, which released radioactive material over a large area.  In both cases, there were significant impacts to the safety, environmental, customer service, property and labor goals.

Palomares: On January 17, 1966, a B-52 and KC-135 crashed during refueling above Palomares, Spain.  The KC 135 exploded, killing the entire crew of four.   The B-52 broke up mid-air, killing three crew members (four more were able to eject) and releasing four nuclear weapons.  Two of the weapons’ parachutes failed, and the weapons were destroyed, releasing radioactive material causing extensive cleanup of the 1,400 contaminated tons of soil and debris.  (Additionally, one of the intact bombs fell into the ocean and was not recovered for three months.) This was the third refuel of the mission and it’s unclear what exactly went wrong, though due to the close proximity required, mid-air refueling is extremely risky.

Thule: A fire began in a B-52 when flammable cushions were stuffed under a seat, covering the heat duct.  Hot air from the engine manifold was redirected into the cabin in an attempt to warm it up, which ignited the cushions.  The crew of the B-52 was unable to extinguish the fire and the pilot lost instrument visibility.  The generators failed (for reasons that aren’t clear), cutting all engine power.  The crew bailed, the plane crashed, and the two weapons were destroyed along with the plane, again releasing radioactive material that led to a four-month cleanup mission.

The causes of these two incidents have one thing in common – both resulted from planes carrying nuclear weapons as part of an airborne alert mission.  Although many safeguards were taken due to the high risk of the missions, extremely serious impacts still resulted.  Thus the decision was made to cancel airborne alert missions.  When the risk is too high, sometimes the only solution is to end the situation resulting in the risk.

We can look at these two incidents together in a Cause Map, or visual root cause analysis.  To view the Outlines,  Timeline and Cause Maps in a three-page downloadable PDF, please click “Download PDF” above.  Or click here to read more.

Number of Poached Rhinos Hits All Time High

By Kim Smiley

Rhinoceros, commonly called rhinos, have long been hunted for their horns.  Three of the five species of rhinos are considered critically endangered.  According to the National Geographic News Watch, at least 443 rhinos were killed in South Africa in 2011, a significant increase from 333 the previous year.  South Africa is home to more than 20,000 rhinos, which is over 90% of the rhinos in Africa.  For a little perspective on how significantly the problem has grown, South Africa only lost about 15 rhinos a year a decade ago.

Experts in the field have concluded that the number of rhinos lost through unnatural means, both illegal poaching and the less common legal hunts allowed by the government, will result in a decline in the population of rhinos.

This problem can be investigated by building a Cause Map, an intuitive, visual root cause analysis method.  To begin a Cause Map, the impact to the organizational goals is first determined and then “why” questions are asked to add Causes to the map.  In this example, the major organizational goal being considered is the impact to the environmental.  The environmental goal is impacted because the poaching of rhinos hit an all time high.  This happened because of two things, poachers want to hunt rhinos and the methods in place to prevent poaching are ineffective.

Poachers want to hunt rhinos because the black market value of their horns is extremely high.  They are worth more than gold by weight.  Poachers are able to sell the horns for high prices because consumers are both willing and able to pay huge sums.  There is a strong market for rhino horn because of long standing beliefs that rhino horn has medicinal uses, primarily in Asian cultures.  The number of people able to come up with large amounts of money has also increased with the rise of an affluent middle class in many Asian countries.

The poaching is also increasing because it’s very difficult to prevent it.  The rhinos live in a large, wild habitat.  It’s simply difficult and expensive to patrol and defend such a large region.  The poachers are very well armed because they are backed by international crime syndicates with deep pockets.  It’s a huge challenge for the governments involved to prevent the poaching from occurring.

This problem will likely continue to increase until the demand for the rhino horns starts to decrease.  Modern medical research has concluded that rhino horn has no medicinal value, but as long as people are willing to pay big money for them, someone will find a way to meet that demand.

As an interesting aside, theft of rhino horns from museums has also risen dramatically.  At least 30 horns were stolen from museums this past year.  Click here to learn more.

Driving While Distracted

By Kim Smiley

A recent study by the National Highway Traffic Safety Administration determined that 3,092 people died last year in car accidents that involved distracted driving.  This means that texting and talking on cell phones contributed to one out of every 11 traffic deaths in the US last year.

It’s difficult to compare this number to the findings from previous years because the definition for distracted driving was refined.  The number for 2011 included only the effects of texting and using a cell phone while driving while other non-technological distractions were included previously.

One thing that is clear, the popularity of texting is rapidly increasing.   196 billion text messages were sent in June 2011,  a nearly 50% increase from June 2009.

A Cause Map can be built to investigate this issue.  A Cause Map is a visual, intuitive form of root cause analysis.  To view a high level Cause Map of this example, click on “Download PDF” above.

One of the causes that contributed to this problem is that people aren’t pulling over when they need to use their cell phones while driving.  There are a number of reasons for this.  The first being, that pulling over is rarely convenient.  Second, people don’t see the need to pull over.  And third, whatever laws might be in place prohibiting distracted driving aren’t effective.

It isn’t clear why people don’t believe they need to pull over.  The study by the National Highway Traffic Safety Administration found that many people don’t think that cell phone usage and texting negatively affect their driving skills.  Many studies have determined that just isn’t the case.  Using a cell phone, either to talk or to text while driving will slow down a driver’s reaction time.   A study by the US Department of Transportation found that sending or receiving a text takes a driver’s eyes off the road for an average of 4.6 seconds.  At 55 mph, a car will travel the length of a football field in that time.

Following these findings, the National Transportation Safety Board (NTSB)  has recommended a nation wide ban on the use of all portable electronic devices, including cell phones.  This would include using a hands-free device to operate a cell phone. The only exceptions to the ban would be use of GPS systems and cell phone use in case of emergency.  Only time will tell what effect the NTSB recommendation has future laws.

Roofing Asphalt Spilled on PA Turnpike

By Kim Smiley

On November 22, 2011, a tanker truck spilled a large quantity of roofing asphalt along nearly 40 miles of the Pennsylvania Turnpike.  The spill damaged many vehicles and caused a traffic nightmare as crews worked for hours to clean the mess up.  The timing of this incident was also unfortunate because it occurred on the evening before Thanksgiving, traditionally a very high traffic time.

This incident can be analyzed by building a Cause Map, which is an intuitive, visual method for performing a root cause analysis.  The first step when building a Cause Map is to determine how the incident impacted the goals of the organization.  In this example, the safety goal was impacted because there was potential for car accidents and injuries.  Thankfully, no one was actually hurt, but it is important to note the potential impact in order to fully understand the ramifications from an event.  Additionally, the traffic delays are an impact to the schedule goal.  The customer service goal was also impacted because over 150 cars were damaged by the spill.

Now the Cause Map is expanded by asking “why” questions and adding Causes that contributed to the incident in order to show the cause and effect relationships.  In this example, there was a potential for injuries because more than 150 cars were damaged while driving.  The cars were damaged because they drove onto a spill of wet roofing asphalt.  The asphalt covered the cars and their wheels with thick, sticky goo and many of them undrivable.  The cars drove over the roofing asphalt because a tanker truck had leaked onto the road over a long distance.

The tanker truck was carrying a large load of the roofing asphalt, between 4,000 and 5,000 gallons, so there was a large quantity that could potentially be spilled.  Initial findings indicate that the tanker truck spilled the asphalt because of a leaking valve.  Details on why the valve leaked aren’t yet available, but they can be added to the Cause Map as they are known.

Another Cause of this incident is the fact that the driver of the truck was unaware that his truck was leaking so he drove almost 40 miles before he stopped and realized that there was a problem.    It was evening when the leak occurred so the driver wasn’t able to see evidence of a leak easily.

Media reports have stated that the driver of the tanker truck will be charged in the incident.  He is facing charges of failing to secure his load and failing to obey a trooper.  The website of the trucking company has posted a statement encouraging affected vehicle owners to file claims though their insurance.

Click on “Download PDF” above to view a high level Cause Map of this incident.

Pilot Locked in Bathroom Nearly Results in Terror Alert

By Kim Smiley

In order for a flight to take off and land safely, many complex mechanical systems have to work for the plane to function properly.  Additionally, pilots need to be properly trained and proficient at their jobs.  Airline processes also have to work in order to smoothly ticket, security screen and board all the passengers.

The number of things that have to work for a successful commercial airline flight is impressive.  A recent incident highlighted that even the smallest hiccup, a broken bathroom lock for example, has the potential to cause big issues in the complex world of commercial flights.

On November 18, 2011, a pilot accidentally got locked inside a bathroom just prior to landing at LaGuardia.  This incident almost resulted in an emergency being declared and terrorist alert being issued.  In order to understand this incident, a Cause Map can be built.  A Cause Map is a visual root cause analysis that illustrates the cause and effect relationship between all the Causes that contribute to an event.

In this example, the copilot considered declaring an emergency because the pilot was gone from the cockpit longer than excepted and an unknown man with an accent knocked on the cockpit door.  The copilot was concerned that this might be a potential hijacking attempt.  His concern was caused by the intended destination being NYC and the 9/11 attacks that occurred there 10 years ago.

The pilot was taking longer than normal because the bathroom door lock had jammed when he had tried to exit after a bathroom break.  The unknown man was a well-intended passenger who had heard the pilot calling for help.  The pilot had given him the password to access the cockpit because all other crew members were inside the cockpit.  There were two reasons that all other crew members were inside the cockpit.  First, regulations require that at least 2 crew members are inside the cockpit at all times.  Second this was a small airplane staffed with only 3 crew members.  If the pilot or copilot needed to use the restroom, the only flight attendant had to enter the cockpit to meet the rules.

Luckily, the pilot was eventually able to free himself from the bathroom and return to the cockpit before anything too exciting happened.  The plane landed as scheduled.  The FBI and Port Authority cops met the plane, but after briefly talking to the passenger involved it was quickly determined that nothing suspicious had occurred.

First Airline Fine for Tarmac Delay

by Kim Smiley

The Department of Transportation (DOT) recently issued the first fine for violating new rules that limit how long passengers can be kept onboard a plane waiting on the tarmac. The new regulations, commonly called the tarmac delay rule, state that passengers may not be kept onboard a plane waiting on the runway for more than 3 hours without being given the opportunity to deplane.  The rules also require that airlines provide adequate food and drinking water for passengers within 2 hours of a plane being delayed on the tarmac and to maintain operable lavatories.  The tarmac delay rule, which went in effect April 2010, was created following several incidents where passengers were kept onboard airplanes for long periods of time.

The incident that resulted in a fine is not the first violation of the 3 hour rule, but this is the first time the DOT has taken the step of issuing a fine.  The potential fees for violating the rules are substantial.  Airlines can be fined $27,500 per passenger when the tarmac delay is beyond 3 hours.  This quickly adds up, especially if multiple flights are involved.  In this example, 15 American Eagle flights were delayed beyond the 3 hour limit on May 29, 2011 at O’Hare International Airport in Chicago.   608 passengers were affected and American Airlines was fined a whopping $900,000.

What happened?  How were so many flights on the tarmac so long?

This example can be analyzed by building a Cause Map, a method for performing a visual root cause analysis.  A Cause Map is built by determining the cause-and-effect relationships between all the causes that contributed to an incident.  Click on “Download PDF” above to view a high level Cause Map of this incident.

As with many airline delays, inclement weather played a major role in this incident.  Flights had been delayed taking off from O’Hare and planes that were scheduled to have departed were still sitting at the gates.  Planes that landed had nowhere to go so they sat on the tarmac waiting for an open gate.

Passengers were not given an opportunity to deplane within 3 hours.  The airline has procedures to get passengers off the planes even if the planes themselves were stuck waiting on the tarmac, but the procedures were not implemented within the 3 hour time limit.  If there was no delay limit, an airline couldn’t violate it so the new creation of the tarmac delay role is also a cause to consider in this incident.

It will be interesting to see how this large, first of its kind fine affects the airline industry as a whole.   Statistics show that the new rules have successfully reduced long tarmac delays.  The first year that the rule was in effect, airlines reported only 20 tarmac delays of more than 3 hours, but in the 12 months prior to rule there were 693 delays of more than 3 hours.  But this improvement may come at a high cost.  Especially now that the DOT has shown that they are willing to issue fines, industry analysts are warning that a possible unintended consequence of the new tarmac will be more canceled flights.  The fines are so hefty that airlines may cancel entire flights rather than risk violating the tarmac delay rules, which would obviously have an impact on travelers.  Only time will tell how the new rules will affect airline travel.

Plane Crash Kills Hockey Team

By ThinkReliability Staff

Hockey fans were devastated when, on September 7, 2011, a Yak-42 plane carrying a Russian hockey team, including many former NHL players, crashed shortly after takeoff.  A total of 44 people were killed, including 36 passengers and 8 crew members.  One crew member survived the crash.  This incident was the 7th fatal crash to occur in Russia since June, and resulted in the loss of the license of the company who operated the plane.

Now that the Russian air safety organization has released results from its investigation, we can map the details of the crash into a Cause Map, or visual root cause analysis. The Cause Map begins with the impacts to the goals.  The deaths of the crew and passengers are an impact to the safety goal.  The company losing its operating license can be considered an impact to the organizational goal.  The damage to the plane is an impact to the property goal.  All these impacts to the goals were caused by the plane crashing into a riverbank shortly after takeoff.

We ask “Why” questions to add more detail to the map.  It has been determined that the plane crashed because it had insufficient speed during takeoff, and the takeoff was not aborted.  It is also possible that the pilot was attempting to emergency land in the river, and missed.  The plane had insufficient speed during takeoff because the brake was pressed.  Studies determined that a foot had to be placed on the brake pedal in order for the brake to be activated.  Because of the force being used on the control column, it is likely that one of the pilots was attempting to push down using his foot as a brace.  The pilots who were flying the plane were more familiar (and were being trained simultaneously on) another type of plane.  This plane – the Yak-40 – has a foot rest where the Yak-42’s brake pedal is located.  Normally pilots are only trained on one type of plane at a time to minimize this sort of confusion.

In addition, at some point during takeoff, the engine was idled.  This would normally indicate that takeoff is being aborted.  Once the engine was brought back into service, it took some time to regain takeoff power – and the speed had already dropped.  Aviation experts say that takeoff could have been aborted and the crash would have been avoided.  However, it does not appear that an abort attempt was made.  Flight recordings indicate confusion and a lack of effective communication in the cockpit.  Prior to the engine being idled, one of the pilots pushed the control stick forward, after which it was pulled back to resume takeoff.  The crew on this plane had never trained together before which is fairly typical, and may be part of the reason for the recent poor safety record of planes in Russia.  Additionally, the pilot had Phenobarbital in his system, which is known to slow reaction time.  Recommendations to attempt to improve the safety of small planes of regional carriers in Russia have been under consideration with the recent rash of crashes.  However, the loss of many popular hockey players may increase the urging to implement these solutions.

To view the Outline and Cause Map, please click “Download PDF” above.  Or click here to read more.

Bluff Collapse Releases Coal Ash

By ThinkReliability  Staff

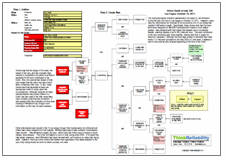
On October 31, 2011, a bluff collapsed at a power plant on the shores of Lake Michigan.  The resulting mudslide took trailers, storage units, at least one truck and an unknown amount of coal ash into the lake, which provides drinking water for more than 40 million people.  Cleanup is ongoing, but the overall impact to the environment has not yet been determined.  Fortunately, no personnel were in the objects that ended up in the lake, so there were no injures.

Although the safety goal was not impacted by this incident, there was the potential for personnel injury.  Additionally, the environmental, customer service, property and labor goals were impacted by the pollution of the lake, loss of property and necessary cleanup.  The causes for these impacts to the goals can be examined in a Cause Map, or visual root cause analysis.

The mudslide which took the objects and coal ash into the lake was caused by insufficient stability of a bluff overlooking the lake.  The bluff’s instability was caused by degraded ground material stability mixed with water and no vegetation.  The vegetation had been removed for construction.  The ground in the area had been filled with coal ash – a practice allowed in previous decades.  Coal ash is less stable than soil, especially when it is exposed to water.  In this case, aerial images suggest that the water seeped into the area from a high water table or from an unlined retention pond used to store storm water.  Although a construction project was ongoing, an environmental impact study – which may have unearthed concerns about the stability of the area – was not considered necessary.

Steps are being taken to clean up the lake to the extent possible.  However, concerns about coal ash in this area and others are prompting a review by Congress to determine how coal ash can be safely dealt with.  Many say this incident suggests that stronger controls are needed.

To view the Outline and Cause Map, please click “Download PDF” above.  Or click here to read more.

BlackBerry’s Widespread Failure

By ThinkReliability Staff

BlackBerry faced yet another setback last month when service went down world-wide for multiple days.  The Research in Motion (RIM) company, already facing stiff competition from other smart phone vendors, apologized profusely for the outage and vowed to woo back its customers.  What caused the extensive and possibly business-ending service outage?

A root cause analysis can help identify what occurred.  The first step is to outline the incident.  The service outage originated in Europe, then spread to four other continents over a 72 hour period.  Customers were furious with the service outage and the slow PR response from the company.  This outage impacted two major RIM goals – to generate revenue for shareholders and maintain customer satisfaction.  Working backwards from these goals, the Cause Map shows what events led to the catastrophic failure and where further investigation is needed.

The company faces a potential loss of revenue if it loses customers.  The company may not have had to worry about the impact of such service outages in the past…except that now there are viable alternatives such as Apple and Android devices.  Continuing to work backwards, customers were upset because of a service outage.  At this point, it helps to examine the BlackBerry network architecture.

BlackBerry’s architecture is fundamentally different from that of Apple and Android.  All data is filtered through the company’s internal service network, before being passed on to carrier networks such as Sprint and Verizon.  Apple and Android don’t provide processing in the middle.  When BlackBerry’s core switch failed in an English data center, a backup switch was supposed to take over.  It had been tested successfully.  Unfortunately the backup didn’t work, leading to a buildup of messages waiting to be processed.  That mountain of messages led to backlogs in other data centers worldwide.  When the switch failed, it also corrupted the database software managing all the messages within the network.  

It turns out that this network architecture is both a liability and at the heart of the company’s business success.  By centrally processing all data messages – both compressing and encrypting them – RIM provides additional security and reduces the processing required at the user device, meaning lower energy use and a longer battery life.  Despite these strengths, RIM would be wise to find out why their network crashed.  As users store more data within the network – as with cloud computing – outages could cripple the system for even longer.

Driver Death at Indy 300

By Kim Smiley

The racing world was filled with sadness with the death of Dan Wheldon during the Indy 300 race in Las Vegas on October 16, 2011.  However, many race-car drivers were not shocked at the occurrence of a 15-car pileup that resulted in Wheldon’s death.  Specifically, these drivers note that the track – which was designed for NASCAR vehicles which travel at much slower speeds – was designed with high banks that allowed cars to accelerate heavily, reaching speeds of up to 225 miles per hour.  This also contributed to the cars remaining very close together, leaving little time or space for drivers to maneuver.  Although the track was smaller in diameter than other tracks (1.5 mile oval compared to the Indy 500’s 2.5 mile oval), it allowed 4 cars to race side by side, as was happening at the time of the crash.

Drivers say that the design of the track, the speed of the cars, and the unusually high number of competitors (34, when a full field is generally 26-28 cars) contributed to the crash.  Also, the open wheel design of Indy cars means that the driver has less control when contacting other cars.  In fact, many drivers said they expected at least one spectacular crash to result, given the circumstances.  Although racecars do have special features that protect drivers in a crash, the cars used in the Indy races have open cockpits, providing less protection.  It also appears that the protective roll hoop was missing on Wheldon’s car, though more information on this has not been released.

Other drivers were also injured in the 15-car pileup, though their injuries were not critical and all others have been released from the hospital.  Wheldon was said to have suffered “unsurvivable head injuries”.   After Wheldon’s death, the race – which had a $5 million prize in hopes to boost ratings – was stopped.   This is the first fatality to occur in Indy racing since 2006.  It is hoped that new safety measures – which Wheldon had been involved with – will continue to make Indy racing safer.  However, there are some drivers that believe that regardless of the safety features in the cars, Indy racing should be done on street courses, not ovals.

To view the Outline and Cause Map, please click “Download PDF” above.