Tag Archives: Aviation

Siberian Plane Crash

By ThinkReliability Staff

Four minutes after take-off on April 1, 2011, an ATR-72 crashed just past Roshchino International Airport in Tyumen, Siberia.  This type of plane has had previous issues with dealing with ice, and has been banned from flying in conditions likely to result in icing in the United States.  However, it has not yet been determined that ice was related to the crash.

To begin a Cause Map – an intuitive, visual root cause analysis – we look at the impacted goals.  In this case, the fatalities and injuries are the primary impact, to the safety goal.  Additionally, this incident, combined with previous air safety issues in Russia (such as the September 2011 crash that killed a Russian hockey team), have eroded public confidence in air safety in the country.  This could be considered an impact to the customer service and production goal.  The plane split into three pieces on impact, which affects the property goal.   Searches and subsequent investigations will likely impact the labor goal.
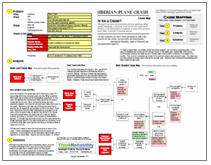
Once the impacts to the goals have been determined, begin the Cause Map with these impacted goals, and ask “Why” questions.  More detail can be added as the investigation progresses.  In this case, the fatalities and injuries were likely caused by the plane’s impact with the ground.  Other mechanical issues are still a possibility; however, the crew did not report any malfunctions prior to the crash.  Disruption of air flow over the wings and jamming of ailerons can be caused by accumulation of ice on the plane.  It has been determined that there was inadequate de-icing agent on the plane, either because it was not applied (according to the deputy head of the airport where the plane took off) or was not applied properly (according to the head of the Russian air transportation agency).  It is known that the weather was cold (the plane landed in a snowy field) and that ATR-72s have trouble with icy conditions, to the point where they have been banned from flying in conditions likely to cause ice in the US.

Officials aren’t ready to name the icing issues as a cause of the crash.  Further investigation will determine which causes did contribute.  In the meantime, all the information that is known can be captured on a Cause Map.  Causes can then be added – or crossed off – as more information becomes available.

To view the Outline and Cause Map, please click “Download PDF” above.

1960 Plane Collision over NYC killed 134

By ThinkReliability Staff

On December 16, 1960, two planes collided about a mile above Brooklyn, New York.  One plane – United Airlines Flight 826 – was in a holding pattern preparing to descend into Idlewild (now John F. Kennedy International) Airport.  The other plane – TWA Flight 266 – was preparing to descend into LaGuardia.  Since both airports serve New York City, they are in fairly close proximity.  The planes, too, were in close proximity – too close, leading to their collision.  In addition to the 84 passengers killed on the United flight (though one would survive for a day) and the 44 passengers killed on the TWA flight, 6 people were killed in the neighborhood of Park Slope, where the United plane landed.

This incident can be outlined in a Cause Map or visual root cause analysis.  We begin with determining the impacted goals.  First, the 134 total deaths were an impact to the safety goal.  The United flight crash resulted in a fire that affected more than 200 buildings, an impact to both the environmental and property goal.   The liability for the crash was assigned to both airlines and the government, an impact to the customer service goal.  There was another impact to the property goal because both planes were destroyed.  Lastly, the labor goal was impacted due to the rescue efforts of the more than 2,500 personnel who responded to the two crash sites.

These impacts to the goals occurred when both planes crashed after colliding.  The planes collided after their flight paths brought them into too close of proximity.  The United flight was estimated to be 12 miles outside its holding  pattern when the crash occurred, possibly because the ground beacon was not working.  The controllers at Idlewild were unaware of the plane’s position as planes were not tracked in holding patterns as it was too difficult to identify individual planes.  The planes were unaware of each other.  The visibility was extremely poor due to foggy, cloudy, sleety and snowy weather.  The United plane had lost the ability to use their instruments due to a loss of a receiver.  (The cause is unknown.)  Additionally, the controllers at LaGuardia (who were guiding in the TWA flight) were unable to reach the TWA plane to warn them of the close proximity of the United plane.

Although comprehensive details are not known about the crash, much of the information used to put together the investigation was obtained from the flight recorder (or “black box”).  This is now a main source of data in aviation accident investigations.  The evidence in this case was used to divide up liability for the accident very exactly – 61% to United Airlines, 24% to the US government and the remainder to TWA.

To view the Outline and Cause Map, please click “Download PDF” above.

Radioactive Release in the 1960s due to Inadvertent Dropping of Nuclear Weapons

By ThinkReliability Staff

In the history of nuclear weapons in the U.S., two accidents (or inadvertent drops) of nuclear weapons have resulted in widespread dispersal of nuclear materials.  These two incidents occurred two years apart, within a week.  The incidents had many similarities: in both cases, a B-52 bomber carrying nuclear weapons was damaged in air during an airborne alert mission and released nuclear weapons, which released radioactive material over a large area.  In both cases, there were significant impacts to the safety, environmental, customer service, property and labor goals.

Palomares: On January 17, 1966, a B-52 and KC-135 crashed during refueling above Palomares, Spain.  The KC 135 exploded, killing the entire crew of four.   The B-52 broke up mid-air, killing three crew members (four more were able to eject) and releasing four nuclear weapons.  Two of the weapons’ parachutes failed, and the weapons were destroyed, releasing radioactive material causing extensive cleanup of the 1,400 contaminated tons of soil and debris.  (Additionally, one of the intact bombs fell into the ocean and was not recovered for three months.) This was the third refuel of the mission and it’s unclear what exactly went wrong, though due to the close proximity required, mid-air refueling is extremely risky.

Thule: A fire began in a B-52 when flammable cushions were stuffed under a seat, covering the heat duct.  Hot air from the engine manifold was redirected into the cabin in an attempt to warm it up, which ignited the cushions.  The crew of the B-52 was unable to extinguish the fire and the pilot lost instrument visibility.  The generators failed (for reasons that aren’t clear), cutting all engine power.  The crew bailed, the plane crashed, and the two weapons were destroyed along with the plane, again releasing radioactive material that led to a four-month cleanup mission.

The causes of these two incidents have one thing in common – both resulted from planes carrying nuclear weapons as part of an airborne alert mission.  Although many safeguards were taken due to the high risk of the missions, extremely serious impacts still resulted.  Thus the decision was made to cancel airborne alert missions.  When the risk is too high, sometimes the only solution is to end the situation resulting in the risk.

We can look at these two incidents together in a Cause Map, or visual root cause analysis.  To view the Outlines,  Timeline and Cause Maps in a three-page downloadable PDF, please click “Download PDF” above.  Or click here to read more.

Pilot Locked in Bathroom Nearly Results in Terror Alert

By Kim Smiley

In order for a flight to take off and land safely, many complex mechanical systems have to work for the plane to function properly.  Additionally, pilots need to be properly trained and proficient at their jobs.  Airline processes also have to work in order to smoothly ticket, security screen and board all the passengers.

The number of things that have to work for a successful commercial airline flight is impressive.  A recent incident highlighted that even the smallest hiccup, a broken bathroom lock for example, has the potential to cause big issues in the complex world of commercial flights.

On November 18, 2011, a pilot accidentally got locked inside a bathroom just prior to landing at LaGuardia.  This incident almost resulted in an emergency being declared and terrorist alert being issued.  In order to understand this incident, a Cause Map can be built.  A Cause Map is a visual root cause analysis that illustrates the cause and effect relationship between all the Causes that contribute to an event.

In this example, the copilot considered declaring an emergency because the pilot was gone from the cockpit longer than excepted and an unknown man with an accent knocked on the cockpit door.  The copilot was concerned that this might be a potential hijacking attempt.  His concern was caused by the intended destination being NYC and the 9/11 attacks that occurred there 10 years ago.

The pilot was taking longer than normal because the bathroom door lock had jammed when he had tried to exit after a bathroom break.  The unknown man was a well-intended passenger who had heard the pilot calling for help.  The pilot had given him the password to access the cockpit because all other crew members were inside the cockpit.  There were two reasons that all other crew members were inside the cockpit.  First, regulations require that at least 2 crew members are inside the cockpit at all times.  Second this was a small airplane staffed with only 3 crew members.  If the pilot or copilot needed to use the restroom, the only flight attendant had to enter the cockpit to meet the rules.

Luckily, the pilot was eventually able to free himself from the bathroom and return to the cockpit before anything too exciting happened.  The plane landed as scheduled.  The FBI and Port Authority cops met the plane, but after briefly talking to the passenger involved it was quickly determined that nothing suspicious had occurred.

First Airline Fine for Tarmac Delay

by Kim Smiley

The Department of Transportation (DOT) recently issued the first fine for violating new rules that limit how long passengers can be kept onboard a plane waiting on the tarmac. The new regulations, commonly called the tarmac delay rule, state that passengers may not be kept onboard a plane waiting on the runway for more than 3 hours without being given the opportunity to deplane.  The rules also require that airlines provide adequate food and drinking water for passengers within 2 hours of a plane being delayed on the tarmac and to maintain operable lavatories.  The tarmac delay rule, which went in effect April 2010, was created following several incidents where passengers were kept onboard airplanes for long periods of time.

The incident that resulted in a fine is not the first violation of the 3 hour rule, but this is the first time the DOT has taken the step of issuing a fine.  The potential fees for violating the rules are substantial.  Airlines can be fined $27,500 per passenger when the tarmac delay is beyond 3 hours.  This quickly adds up, especially if multiple flights are involved.  In this example, 15 American Eagle flights were delayed beyond the 3 hour limit on May 29, 2011 at O’Hare International Airport in Chicago.   608 passengers were affected and American Airlines was fined a whopping $900,000.

What happened?  How were so many flights on the tarmac so long?

This example can be analyzed by building a Cause Map, a method for performing a visual root cause analysis.  A Cause Map is built by determining the cause-and-effect relationships between all the causes that contributed to an incident.  Click on “Download PDF” above to view a high level Cause Map of this incident.

As with many airline delays, inclement weather played a major role in this incident.  Flights had been delayed taking off from O’Hare and planes that were scheduled to have departed were still sitting at the gates.  Planes that landed had nowhere to go so they sat on the tarmac waiting for an open gate.

Passengers were not given an opportunity to deplane within 3 hours.  The airline has procedures to get passengers off the planes even if the planes themselves were stuck waiting on the tarmac, but the procedures were not implemented within the 3 hour time limit.  If there was no delay limit, an airline couldn’t violate it so the new creation of the tarmac delay role is also a cause to consider in this incident.

It will be interesting to see how this large, first of its kind fine affects the airline industry as a whole.   Statistics show that the new rules have successfully reduced long tarmac delays.  The first year that the rule was in effect, airlines reported only 20 tarmac delays of more than 3 hours, but in the 12 months prior to rule there were 693 delays of more than 3 hours.  But this improvement may come at a high cost.  Especially now that the DOT has shown that they are willing to issue fines, industry analysts are warning that a possible unintended consequence of the new tarmac will be more canceled flights.  The fines are so hefty that airlines may cancel entire flights rather than risk violating the tarmac delay rules, which would obviously have an impact on travelers.  Only time will tell how the new rules will affect airline travel.

Plane Crash Kills Hockey Team

By ThinkReliability Staff

Hockey fans were devastated when, on September 7, 2011, a Yak-42 plane carrying a Russian hockey team, including many former NHL players, crashed shortly after takeoff.  A total of 44 people were killed, including 36 passengers and 8 crew members.  One crew member survived the crash.  This incident was the 7th fatal crash to occur in Russia since June, and resulted in the loss of the license of the company who operated the plane.

Now that the Russian air safety organization has released results from its investigation, we can map the details of the crash into a Cause Map, or visual root cause analysis. The Cause Map begins with the impacts to the goals.  The deaths of the crew and passengers are an impact to the safety goal.  The company losing its operating license can be considered an impact to the organizational goal.  The damage to the plane is an impact to the property goal.  All these impacts to the goals were caused by the plane crashing into a riverbank shortly after takeoff.

We ask “Why” questions to add more detail to the map.  It has been determined that the plane crashed because it had insufficient speed during takeoff, and the takeoff was not aborted.  It is also possible that the pilot was attempting to emergency land in the river, and missed.  The plane had insufficient speed during takeoff because the brake was pressed.  Studies determined that a foot had to be placed on the brake pedal in order for the brake to be activated.  Because of the force being used on the control column, it is likely that one of the pilots was attempting to push down using his foot as a brace.  The pilots who were flying the plane were more familiar (and were being trained simultaneously on) another type of plane.  This plane – the Yak-40 – has a foot rest where the Yak-42’s brake pedal is located.  Normally pilots are only trained on one type of plane at a time to minimize this sort of confusion.

In addition, at some point during takeoff, the engine was idled.  This would normally indicate that takeoff is being aborted.  Once the engine was brought back into service, it took some time to regain takeoff power – and the speed had already dropped.  Aviation experts say that takeoff could have been aborted and the crash would have been avoided.  However, it does not appear that an abort attempt was made.  Flight recordings indicate confusion and a lack of effective communication in the cockpit.  Prior to the engine being idled, one of the pilots pushed the control stick forward, after which it was pulled back to resume takeoff.  The crew on this plane had never trained together before which is fairly typical, and may be part of the reason for the recent poor safety record of planes in Russia.  Additionally, the pilot had Phenobarbital in his system, which is known to slow reaction time.  Recommendations to attempt to improve the safety of small planes of regional carriers in Russia have been under consideration with the recent rash of crashes.  However, the loss of many popular hockey players may increase the urging to implement these solutions.

To view the Outline and Cause Map, please click “Download PDF” above.  Or click here to read more.

Toxic Fumes on Aircraft

By ThinkReliability Staff

A settlement against an aircraft manufacturer, with regards to a claim that faulty design allowed toxic fumes to enter the cabin, occurred in early October 2011.  It is the first of its kind to occur in the U.S., but may not be the last.  A documentary entitled “Angel Without Wings” is attempting to bring more attention to the issue, which air safety advocates claim has affected the health and job-readiness of some airline crewmembers.

Although the aircraft manufacturing and operating industries maintain that the air in cabins is safe, breaches are rare, and that the small amount of toxicity that may get into the cabin is not enough to affect human health, the issue is expected to gain more attention, as some industry officials maintain that approximately one flight a day involves leakage of toxic fumes into the passenger cabin of an aircraft.  Although there is debate about the amount of fumes required to cause various health effects, allowing toxic fumes of any amount into a passenger cabin is an impact to both the safety and environment goal.  Additionally, the lawsuit – and the potential of more to come – against the manufacturer is an impact to the customer service goal.  Although the suits have been brought by crew members, there is also a concern for the safety of passengers with respect to exposure to the contaminated air.

The toxic smoke and fumes enter the plane’s air conditioning system when engine air gets into the bleed-air system, which directs air bled from engine compressors into the cabin.  Because there is currently no effective way for crew members to determine that the air is contaminated – no detectors and insufficient training for these crew members to recognize the source and possible outcome of the fumes – the air continues to be fed to the cabin. The creators of the documentary, and other air safety advocates, are requesting that better filters be installed to prevent the toxic fumes to enter the cabin, less toxic oil be used so that the fumes from any leaking oil are less damaging to human health, that detectors be installed in air ducts to notify crew of potential toxicity in the air supply, and better education and training to help crew members identify the potential for exposure to toxic fumes.  However, the manufacturer’s newest design makes all this unnecessary by using an aircraft design that provides air from electric compressors.  Given the length of time that aircraft remain in the air, it will be decades before the system may be phased out.  In the meantime, advocates hope that other corrective actions will be implemented to decrease the potential of exposure to passengers and crew.

To view the Outline and Cause Map, please click “Download PDF” above.  Or click here to read more.

Crash Causes Deaths at Air Race

By ThinkReliability Staff

Sad news is nothing new for the National Championship Air Races – there have been 29 deaths associated with the races in its 47-year history.  However, the ten deaths and dozens of injuries (some extremely serious) resulting from a plane crash and explosion on September 16, 2011 have brought attention to the safety of air racing.

Although full details of the causes of the crash and explosion have not been determined by the National Transportation Safety Board, we can begin a comprehensive root cause analysis with the information available so far by building a Cause Map.  First, we capture the basic details (such as the date and time of the incident) in the Outline.  Then we record the impacts to the goals.  In this case, there was a significant impact to the safety goal, considering the high number of deaths and significant injuries.  The customer service goal can be considered to be impacted because the spectators at the show were not sufficiently protected from injury.  (The FAA grants approval to air shows based on safety of the spectators from a crash.)   The remaining days of the race were cancelled – an impact to the schedule goal.  The plane was destroyed, an impact to the property goal, and the resulting NTSB investigation will cause an impact to the labor goal because of the resources required to complete the investigation.

Once we have captured these impacts to the goals, we can use them to begin the analysis.  The injuries and deaths occurred from the plane crashing into the VIP section and the subsequent explosion which resulted in shrapnel injuries.  The pilot lost control of the plane and did not have sufficient time to recover (as evidenced by there being no indication that he made a distress call).  It’s unclear what exactly caused the loss of control; however, the plane had been modified to increase its speed, which would have impacted its stability in flight.  Additionally, photos taken just before the crash appear to indicate that a portion of the tail fell off, but the reason why has not yet been discovered.  What happened to the tail section, and how the modifications affected control of the plane, are questions the NTSB will examine in their report.

Because of the goal of an air race – traveling around a course at low altitudes and high speeds – it’s no surprise that the pilot did not have sufficient time to recover control before crashing.  Given that these conditions are expected during air races – and appear to be an acceptable risk to pilots, who continue to race even with the high number of crashes and fatalities that result – it appears that there needs to be more consideration of how spectators are protected from crashes and the shrapnel that can result from the destruction of a plane.

When more evidence is gathered, more information can be added to  the Cause Map.  Once that occurs, the NTSB can examine the causes contributing to the deaths at the air race, and make recommendations on how future deaths can be avoided.

To view the Outline and Cause Map, please click “Download PDF” above.

Plane Clips Another While Taxiing at JFK Airport

By Kim Smiley

Around 8:30 pm on April 11, 2011, a large passenger airplane taxiing at John F. Kennedy Airport in New York clipped the wing of a smaller plane.  The larger plane involved in the incident was an Airbus A380 carrying 485 passengers and 25 crew members.  The smaller plane was a Bombardier CRJ and carrying 52 passengers and 4 crew members at the time it was clipped.

At the time of the accident, the Airbus was taxiing to take off and the CRJ had recently landed and was waiting to park.  The incident was caught on amateur video and it appears that the left wing tip of the Airbus struck the left horizontal stabilizer of the CRJ. No injuries were reported, but both planes sustained some damage.

After the planes made contact, the fire department responded as a precautionary measure.  Passengers were deplaned from the Airbus so that the planes could be inspected and information could be gathered to support the investigation.

At this time there is limited information available about what caused this incident, but the National Transportation and Safety Board (NTSB) has begun an investigation.  The NTSB has requested fight recorders from both airplanes and also plans to review the air traffic control tapes and the ground movement radar data to determine how this happened.

Even through the investigation is just getting started, it is still possible to create a Cause Map based on what is known.  The first step is to create an Outline of the event by determining the impact to the organization goals.  In this example, the Safety Goal was impacted because there was the potential for injuries, the Customer Service goal was impacted because the passengers were unable to reach their destination, the Production Schedule Goal was impacted because the flight was unable to depart and the Material and Labor goal was impacted because there was damage to both planes.

From this point, Causes can be added to the cause map by asking “why” question. Missing information can be noted by adding a Cause box with a “?”.  Any additional information can be added later.  To see an initial Cause Map of this incident and the Outline, click on the “Download PDF” above.

Grounding the 737’s: SWA Flight 812

By ThinkReliability Staff

As new information comes to light, processes need to be reevaluated.  A hole in the fuselage of a 15-year-old Boeing 737-300 led to the emergency descent of Southwest Airlines Flight 812.  737’s have been grounded as federal investigators determine why the hole appeared.  At the moment, consensus is that a lap joint supporting the top of the fuselage cracked.

While the investigation is still in the early stages, it appears that stress fatigue caused a lap joint to fail.  Stress fatigue is a well known phenomenon, caused in aircraft by the constant pressurization and depressurization occurring during takeoff and landing.  Mechanical engineers designing the aircraft would have been well aware of this phenomenon.  The S-N curve, which plots a metal’s expected lifespan vs. stress, has been used for well over a century.

Just as a car needs preventative maintenance, planes are inspected regularly for parts that are ready to fail.  However, the crack in lap joint wasn’t detected during routine maintenance.  In fact, that joint wasn’t even checked.  It wasn’t an oversight however.  Often the design engineers also set the maintenance schedule, because they hold the expertise needed to determine a reasonable procedure.  The engineers didn’t expect the part to fail for at least 20,000 more flight hours.  At the moment, it’s unclear why that is.

In response to the incident, the FAA has grounded all similar aircraft and ordered inspections of flights nearing 30,000 flight hours.   Cracks have been found in 5 aircraft of 80 grounded aircraft so far.  However a looming concern is how to deal with 737’s not based in the United States, and therefore outside the FAA’s jurisdiction.