Tag Archives: accident

1960 Plane Collision over NYC killed 134

By ThinkReliability Staff

On December 16, 1960, two planes collided about a mile above Brooklyn, New York.  One plane – United Airlines Flight 826 – was in a holding pattern preparing to descend into Idlewild (now John F. Kennedy International) Airport.  The other plane – TWA Flight 266 – was preparing to descend into LaGuardia.  Since both airports serve New York City, they are in fairly close proximity.  The planes, too, were in close proximity – too close, leading to their collision.  In addition to the 84 passengers killed on the United flight (though one would survive for a day) and the 44 passengers killed on the TWA flight, 6 people were killed in the neighborhood of Park Slope, where the United plane landed.

This incident can be outlined in a Cause Map or visual root cause analysis.  We begin with determining the impacted goals.  First, the 134 total deaths were an impact to the safety goal.  The United flight crash resulted in a fire that affected more than 200 buildings, an impact to both the environmental and property goal.   The liability for the crash was assigned to both airlines and the government, an impact to the customer service goal.  There was another impact to the property goal because both planes were destroyed.  Lastly, the labor goal was impacted due to the rescue efforts of the more than 2,500 personnel who responded to the two crash sites.

These impacts to the goals occurred when both planes crashed after colliding.  The planes collided after their flight paths brought them into too close of proximity.  The United flight was estimated to be 12 miles outside its holding  pattern when the crash occurred, possibly because the ground beacon was not working.  The controllers at Idlewild were unaware of the plane’s position as planes were not tracked in holding patterns as it was too difficult to identify individual planes.  The planes were unaware of each other.  The visibility was extremely poor due to foggy, cloudy, sleety and snowy weather.  The United plane had lost the ability to use their instruments due to a loss of a receiver.  (The cause is unknown.)  Additionally, the controllers at LaGuardia (who were guiding in the TWA flight) were unable to reach the TWA plane to warn them of the close proximity of the United plane.

Although comprehensive details are not known about the crash, much of the information used to put together the investigation was obtained from the flight recorder (or “black box”).  This is now a main source of data in aviation accident investigations.  The evidence in this case was used to divide up liability for the accident very exactly – 61% to United Airlines, 24% to the US government and the remainder to TWA.

To view the Outline and Cause Map, please click “Download PDF” above.

Fatal Cruise Ship Accident

By ThinkReliability Staff

At least 11 people have been killed – with 24 still missing – after the cruise ship Costa Concordia ran aground on rocks near the island of Giglio, Italy.  The ship was taken  manually up to 4 miles off course on a route not  authorized by the company.

This incident can be thoroughly examined in a visual root cause analysis built as a Cause Map.  First, we examine the impacts to the goals for this incident.  The confirmed deaths and missing people are a significant impact to the safety goal.   Additionally, the environmental goal is impacted because of the potential for a spill of the 500,000 gallons of fuel still onboard.  The required evacuation of the ship can be considered a customer impact goal.  The loss of use of the ship – estimated to be $85 to $95 million for lost usage in the next year and the decrease in bookings due to concern over the incident can be considered an impact to the production/schedule goal.  The damage to the ship, which was recently built and insured for approximately $575 million, is an impact to the property goal and the rescue and recovery efforts are an impact to the labor goal.

Once we have these impacts to the goals, we can begin an analysis by asking “why” questions.  The impact to the safety goal – dead and missing passengers and crew – were caused by the ship running aground on rocks and  some issues with the evacuation process.  The ship ran aground on rocks because it got too close to the island in a manually programmed unauthorized deviation of the ship’s route, potentially to provide passengers with a better view.  This deviation in route, sometimes called a “fly by”, had been previously authorized by the company.  No crew members questioned the change in route by the Captain, noting that onboard he is solely responsible for the ship.  (Note that with great power comes great responsibility, and the Captain has been charged with manslaughter.)   Although the ship contains alarms meant to warn the crew when the ship goes off-course, these alarms are deactivated when the ship route is manually altered.

There were some issues with the evacuation of the ship, though as the company notes, not due to the evacuation procedure, which was externally reviewed in November.  Rather the issues were caused by the severe list of the ship (it was leaning almost completely to one side), which affects the ability to use the lifeboats.  Additionally, some of the passengers (who had just come aboard) had not yet completed a lifeboat drill.  The drill is required to be performed within 24 hours of boarding the ship and was scheduled for the morning after departure. The grounding occurred just 3.5 hours after departure.

Currently, rescue and recovery efforts continue.  Attempts are being made to remove fuel from the ship, which is in a protected area.  Concern about cruise ships in the area have previously been raised, with some wanting to limit ships that are allowed in the area.  Additionally, both the cruise ship company and the government are reconsidering the timing of lifeboat drills in order to ensure the best results for passengers in issues like these.

To view the Root Cause Analysis investigation, please click “Download PDF” above

Radioactive Release in the 1960s due to Inadvertent Dropping of Nuclear Weapons

By ThinkReliability Staff

In the history of nuclear weapons in the U.S., two accidents (or inadvertent drops) of nuclear weapons have resulted in widespread dispersal of nuclear materials.  These two incidents occurred two years apart, within a week.  The incidents had many similarities: in both cases, a B-52 bomber carrying nuclear weapons was damaged in air during an airborne alert mission and released nuclear weapons, which released radioactive material over a large area.  In both cases, there were significant impacts to the safety, environmental, customer service, property and labor goals.

Palomares: On January 17, 1966, a B-52 and KC-135 crashed during refueling above Palomares, Spain.  The KC 135 exploded, killing the entire crew of four.   The B-52 broke up mid-air, killing three crew members (four more were able to eject) and releasing four nuclear weapons.  Two of the weapons’ parachutes failed, and the weapons were destroyed, releasing radioactive material causing extensive cleanup of the 1,400 contaminated tons of soil and debris.  (Additionally, one of the intact bombs fell into the ocean and was not recovered for three months.) This was the third refuel of the mission and it’s unclear what exactly went wrong, though due to the close proximity required, mid-air refueling is extremely risky.

Thule: A fire began in a B-52 when flammable cushions were stuffed under a seat, covering the heat duct.  Hot air from the engine manifold was redirected into the cabin in an attempt to warm it up, which ignited the cushions.  The crew of the B-52 was unable to extinguish the fire and the pilot lost instrument visibility.  The generators failed (for reasons that aren’t clear), cutting all engine power.  The crew bailed, the plane crashed, and the two weapons were destroyed along with the plane, again releasing radioactive material that led to a four-month cleanup mission.

The causes of these two incidents have one thing in common – both resulted from planes carrying nuclear weapons as part of an airborne alert mission.  Although many safeguards were taken due to the high risk of the missions, extremely serious impacts still resulted.  Thus the decision was made to cancel airborne alert missions.  When the risk is too high, sometimes the only solution is to end the situation resulting in the risk.

We can look at these two incidents together in a Cause Map, or visual root cause analysis.  To view the Outlines,  Timeline and Cause Maps in a three-page downloadable PDF, please click “Download PDF” above.  Or click here to read more.

Driving While Distracted

By Kim Smiley

A recent study by the National Highway Traffic Safety Administration determined that 3,092 people died last year in car accidents that involved distracted driving.  This means that texting and talking on cell phones contributed to one out of every 11 traffic deaths in the US last year.

It’s difficult to compare this number to the findings from previous years because the definition for distracted driving was refined.  The number for 2011 included only the effects of texting and using a cell phone while driving while other non-technological distractions were included previously.

One thing that is clear, the popularity of texting is rapidly increasing.   196 billion text messages were sent in June 2011,  a nearly 50% increase from June 2009.

A Cause Map can be built to investigate this issue.  A Cause Map is a visual, intuitive form of root cause analysis.  To view a high level Cause Map of this example, click on “Download PDF” above.

One of the causes that contributed to this problem is that people aren’t pulling over when they need to use their cell phones while driving.  There are a number of reasons for this.  The first being, that pulling over is rarely convenient.  Second, people don’t see the need to pull over.  And third, whatever laws might be in place prohibiting distracted driving aren’t effective.

It isn’t clear why people don’t believe they need to pull over.  The study by the National Highway Traffic Safety Administration found that many people don’t think that cell phone usage and texting negatively affect their driving skills.  Many studies have determined that just isn’t the case.  Using a cell phone, either to talk or to text while driving will slow down a driver’s reaction time.   A study by the US Department of Transportation found that sending or receiving a text takes a driver’s eyes off the road for an average of 4.6 seconds.  At 55 mph, a car will travel the length of a football field in that time.

Following these findings, the National Transportation Safety Board (NTSB)  has recommended a nation wide ban on the use of all portable electronic devices, including cell phones.  This would include using a hands-free device to operate a cell phone. The only exceptions to the ban would be use of GPS systems and cell phone use in case of emergency.  Only time will tell what effect the NTSB recommendation has future laws.

Plane Crash Kills Hockey Team

By ThinkReliability Staff

Hockey fans were devastated when, on September 7, 2011, a Yak-42 plane carrying a Russian hockey team, including many former NHL players, crashed shortly after takeoff.  A total of 44 people were killed, including 36 passengers and 8 crew members.  One crew member survived the crash.  This incident was the 7th fatal crash to occur in Russia since June, and resulted in the loss of the license of the company who operated the plane.

Now that the Russian air safety organization has released results from its investigation, we can map the details of the crash into a Cause Map, or visual root cause analysis. The Cause Map begins with the impacts to the goals.  The deaths of the crew and passengers are an impact to the safety goal.  The company losing its operating license can be considered an impact to the organizational goal.  The damage to the plane is an impact to the property goal.  All these impacts to the goals were caused by the plane crashing into a riverbank shortly after takeoff.

We ask “Why” questions to add more detail to the map.  It has been determined that the plane crashed because it had insufficient speed during takeoff, and the takeoff was not aborted.  It is also possible that the pilot was attempting to emergency land in the river, and missed.  The plane had insufficient speed during takeoff because the brake was pressed.  Studies determined that a foot had to be placed on the brake pedal in order for the brake to be activated.  Because of the force being used on the control column, it is likely that one of the pilots was attempting to push down using his foot as a brace.  The pilots who were flying the plane were more familiar (and were being trained simultaneously on) another type of plane.  This plane – the Yak-40 – has a foot rest where the Yak-42’s brake pedal is located.  Normally pilots are only trained on one type of plane at a time to minimize this sort of confusion.

In addition, at some point during takeoff, the engine was idled.  This would normally indicate that takeoff is being aborted.  Once the engine was brought back into service, it took some time to regain takeoff power – and the speed had already dropped.  Aviation experts say that takeoff could have been aborted and the crash would have been avoided.  However, it does not appear that an abort attempt was made.  Flight recordings indicate confusion and a lack of effective communication in the cockpit.  Prior to the engine being idled, one of the pilots pushed the control stick forward, after which it was pulled back to resume takeoff.  The crew on this plane had never trained together before which is fairly typical, and may be part of the reason for the recent poor safety record of planes in Russia.  Additionally, the pilot had Phenobarbital in his system, which is known to slow reaction time.  Recommendations to attempt to improve the safety of small planes of regional carriers in Russia have been under consideration with the recent rash of crashes.  However, the loss of many popular hockey players may increase the urging to implement these solutions.

To view the Outline and Cause Map, please click “Download PDF” above.  Or click here to read more.

Bluff Collapse Releases Coal Ash

By ThinkReliability  Staff

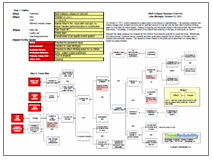
On October 31, 2011, a bluff collapsed at a power plant on the shores of Lake Michigan.  The resulting mudslide took trailers, storage units, at least one truck and an unknown amount of coal ash into the lake, which provides drinking water for more than 40 million people.  Cleanup is ongoing, but the overall impact to the environment has not yet been determined.  Fortunately, no personnel were in the objects that ended up in the lake, so there were no injures.

Although the safety goal was not impacted by this incident, there was the potential for personnel injury.  Additionally, the environmental, customer service, property and labor goals were impacted by the pollution of the lake, loss of property and necessary cleanup.  The causes for these impacts to the goals can be examined in a Cause Map, or visual root cause analysis.

The mudslide which took the objects and coal ash into the lake was caused by insufficient stability of a bluff overlooking the lake.  The bluff’s instability was caused by degraded ground material stability mixed with water and no vegetation.  The vegetation had been removed for construction.  The ground in the area had been filled with coal ash – a practice allowed in previous decades.  Coal ash is less stable than soil, especially when it is exposed to water.  In this case, aerial images suggest that the water seeped into the area from a high water table or from an unlined retention pond used to store storm water.  Although a construction project was ongoing, an environmental impact study – which may have unearthed concerns about the stability of the area – was not considered necessary.

Steps are being taken to clean up the lake to the extent possible.  However, concerns about coal ash in this area and others are prompting a review by Congress to determine how coal ash can be safely dealt with.  Many say this incident suggests that stronger controls are needed.

To view the Outline and Cause Map, please click “Download PDF” above.  Or click here to read more.

Crash Causes Deaths at Air Race

By ThinkReliability Staff

Sad news is nothing new for the National Championship Air Races – there have been 29 deaths associated with the races in its 47-year history.  However, the ten deaths and dozens of injuries (some extremely serious) resulting from a plane crash and explosion on September 16, 2011 have brought attention to the safety of air racing.

Although full details of the causes of the crash and explosion have not been determined by the National Transportation Safety Board, we can begin a comprehensive root cause analysis with the information available so far by building a Cause Map.  First, we capture the basic details (such as the date and time of the incident) in the Outline.  Then we record the impacts to the goals.  In this case, there was a significant impact to the safety goal, considering the high number of deaths and significant injuries.  The customer service goal can be considered to be impacted because the spectators at the show were not sufficiently protected from injury.  (The FAA grants approval to air shows based on safety of the spectators from a crash.)   The remaining days of the race were cancelled – an impact to the schedule goal.  The plane was destroyed, an impact to the property goal, and the resulting NTSB investigation will cause an impact to the labor goal because of the resources required to complete the investigation.

Once we have captured these impacts to the goals, we can use them to begin the analysis.  The injuries and deaths occurred from the plane crashing into the VIP section and the subsequent explosion which resulted in shrapnel injuries.  The pilot lost control of the plane and did not have sufficient time to recover (as evidenced by there being no indication that he made a distress call).  It’s unclear what exactly caused the loss of control; however, the plane had been modified to increase its speed, which would have impacted its stability in flight.  Additionally, photos taken just before the crash appear to indicate that a portion of the tail fell off, but the reason why has not yet been discovered.  What happened to the tail section, and how the modifications affected control of the plane, are questions the NTSB will examine in their report.

Because of the goal of an air race – traveling around a course at low altitudes and high speeds – it’s no surprise that the pilot did not have sufficient time to recover control before crashing.  Given that these conditions are expected during air races – and appear to be an acceptable risk to pilots, who continue to race even with the high number of crashes and fatalities that result – it appears that there needs to be more consideration of how spectators are protected from crashes and the shrapnel that can result from the destruction of a plane.

When more evidence is gathered, more information can be added to  the Cause Map.  Once that occurs, the NTSB can examine the causes contributing to the deaths at the air race, and make recommendations on how future deaths can be avoided.

To view the Outline and Cause Map, please click “Download PDF” above.

Explosion at Nuclear Waste Site Kills One

By Kim Smiley

An explosion at a nuclear waste processing site in France killed one and injured four workers on September 12, 2011.  The investigation is still ongoing, but it is still possible to create a Cause Map, a visual root cause analysis, that contains all known information on the incident.  As more information becomes available, the Cause Map can easily be expanded to incorporate all relevant details.  One advantage of Cause Mapping is that it can be used to document all information at each step of the investigation process in an intuitive way, in a single location.

When the word “nuclear” is involved emotions and fears can run high, especially following the recent events at the Fukushima nuclear plant in Japan.  This incident is a good example where providing clear information can help calm the situation.  The explosion in France happened when a furnace used to burn nuclear waste failed.  The cause of the explosion itself isn’t known at this time, but there is some relevant background information available that helps explains the potential ramifications of the explosion.

The key to understanding the impact of this incident is the type of nuclear waste that was being burned.  According to statements by the French government, the furnace involved was only used to burn waste with very low level contamination.  It burned things such as gloves and overalls as well as metal waste like tools and pumps.  No objects that were part of a reactor were treated in the furnace.  There are also no reactors at the site that could be potentially damaged by explosion.

There was no radiation leakage detected and the potential for large amounts of released radiation wasn’t there based on the type of material being processed.  It was a horrible accident that resulted in a death and severe injuries, but there was no risk to public health.

How France views nuclear power is also a bit of background worth knowing.  France is the world’s most nuclear power dependent country.  Fifty-eight reactors generate nearly three fourths of France’s power.  France is also a major exporter of nuclear technology.  The public relations issues associated with a nuclear disaster in France would be very complicated.

Once the investigation into this incident is complete, solutions can complete be determined and implemented to help prevent any future occurrences.

Release of Chemicals at a Manufacturing Facility

By ThinkReliability Staff

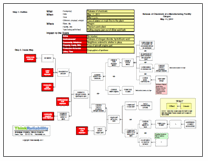
A recent issue at a parts plant in Oregon caused a release of hazardous chemicals which resulted in evacuation of the workers and in-home sheltering for neighbors of the plant.  Thanks to these precautions, nobody was injured.  However, attempts to stop the leak lasted for more than a day.  There were many contributors to the incident, which can be considered in a root cause analysis presented as a Cause Map.

To begin a Cause Map, first fill out the outline, containing basic information on the event and impacts to the goals.  Filling out the impacts to the goals is important not only because it provides a basis for the Cause Map, but because goals may have been impacted that are not immediately obvious.  For example, in this case a part was lost.

Once the outline is completed, the analysis (Cause Map) can begin.  Start with the impacts to the goals and ask why questions to complete the Cause Map.  For example, workers were evacuated because of the release of nitrogen dioxide and hydrofluoric acid.  The release occurred because the scrubber system was non-functional and a reaction was occurring that was producing nitrogen dioxide.  The scrubber system had been tripped due to a loss of power at the plant, believed to have been related to switch maintenance previously performed across the street.Normally, the switch could be reset, but the switch was located in a contaminated area that could only be accessed by an electrician – and there were no electricians who were certified to use the necessary protective gear.  The reaction that was producing the nitrogen oxide was caused when a titanium part was dipped into a dilute acid bath as part of the manufacturing process.

When the responders realized they could not reset the scrubber system switch, they decided to lift the part out of the acid bath, removing the reaction that was causing the bulk of the chemicals in the release.  However, the hoist switch was tripped by the same issue that tripped the scrubber system.  Although the switch was accessible, when it was flipped by firefighters, it didn’t reset the hoist, leaving the part in the acid bath, until it completely dissolved.

Although we’ve captured a lot of information in this Cause Map, subsequent investigations into the incident and the response raised some more issues that could be addressed in a one page Cause Map.  The detail provided on a Cause Map should be commensurate with the impacts to the goals.  In this case, although there were no injuries, because of the serious impact on the company’s production goals, as well as the impact to the neighboring community, all avenues for improvement should be explored.

To view the Outline and Cause Map, please click “Download PDF” above.  Or click here to read more.

Train Crash in China Kills 39

By Kim Smiley

It is rare for the conduct of the investigation to be one of the biggest headlines in the week following an accident, but this has been the case after a recent train crash in China.  On July 23, 2011, two trains collided in Wenzhou, China, killing 39 and sending another 192 people to the hospital.

What appears to have happened is that a train moving at speed rear ended another train that had stalled on the tracks. It was announced that the first train had stalled after a lightning strike.  Soon after the accident, people reported seeing the damaged train cars broken apart by back hoes and buried.  Meaning the evidence was literally being buried without ever having been thoroughly examined.  The Chinese government stated that the cars contained “State-level” technology and were being buried to keep it safe.

The internet frenzy and public outrage fueled by how this investigation was handled was impressive. According to a recent New York Times article, 26 million messages about the tragedy have been posted on China’s popular twitter-like microblogs.  So powerful has the public outrage been that the first car from the oncoming train has been dug up and sent to Wenzhou for analysis.

More information  on the technical reasons for the train crash is slowly coming to light.  Five days after the accident, government officials have stated that a signal which would have stopped the moving train failed to turn red and the error wasn’t noticed by workers.  There is talk about system design errors and inadequate training.

It’s unlikely that all the details will ever be public knowledge, but there is one takeaway from this accident that can be applied to any organization in any industry that performs investigations – the importance of transparency. The Chinese government spent over $100 billion in 2010 expanding the high speed rail system, but if people don’t feel safe riding the rail system it won’t be money well spent.  Customers need to feel that an adequate investigation has been performed following an accident or they won’t use the products produced by the company.

To view an initial Cause Map built for this train accident, please click on “Download PDF” above.  A Cause Map is an intuitive, visual method of performing a root cause analysis.  One of the benefits of a Cause Map is that it’s easily understood and can help improve the transparency of an investigation for all involved.