Dissecting Safety Incidents: Using root cause analysis to reveal culture issues

By ThinkReliability Staff

The objective of a root cause analysis investigation is to prevention.  The causes of an incident are investigated, so that solutions can be developed and implemented, to reduce the risk of the same or a similar problem from occurring.  The process sounds easy, but in practice it can become more involved.  For example, what do you do when one of the identified causes is “lack of safety culture”?  How exactly do you solve that?

This is the issue that the Washington DC Metrorail (Metro) is currently facing.  The National Transportation and Safety Board (NSTB) recently released findings from the investigation of a DC metro train crash that killed nine last June.  (See our previous blog for more details). Predictably, the NSTB findings include several technical issues including failed track circuits and lack of adequate testing, but the list of causes also includes items like lack of safety culture and ineffective oversight.
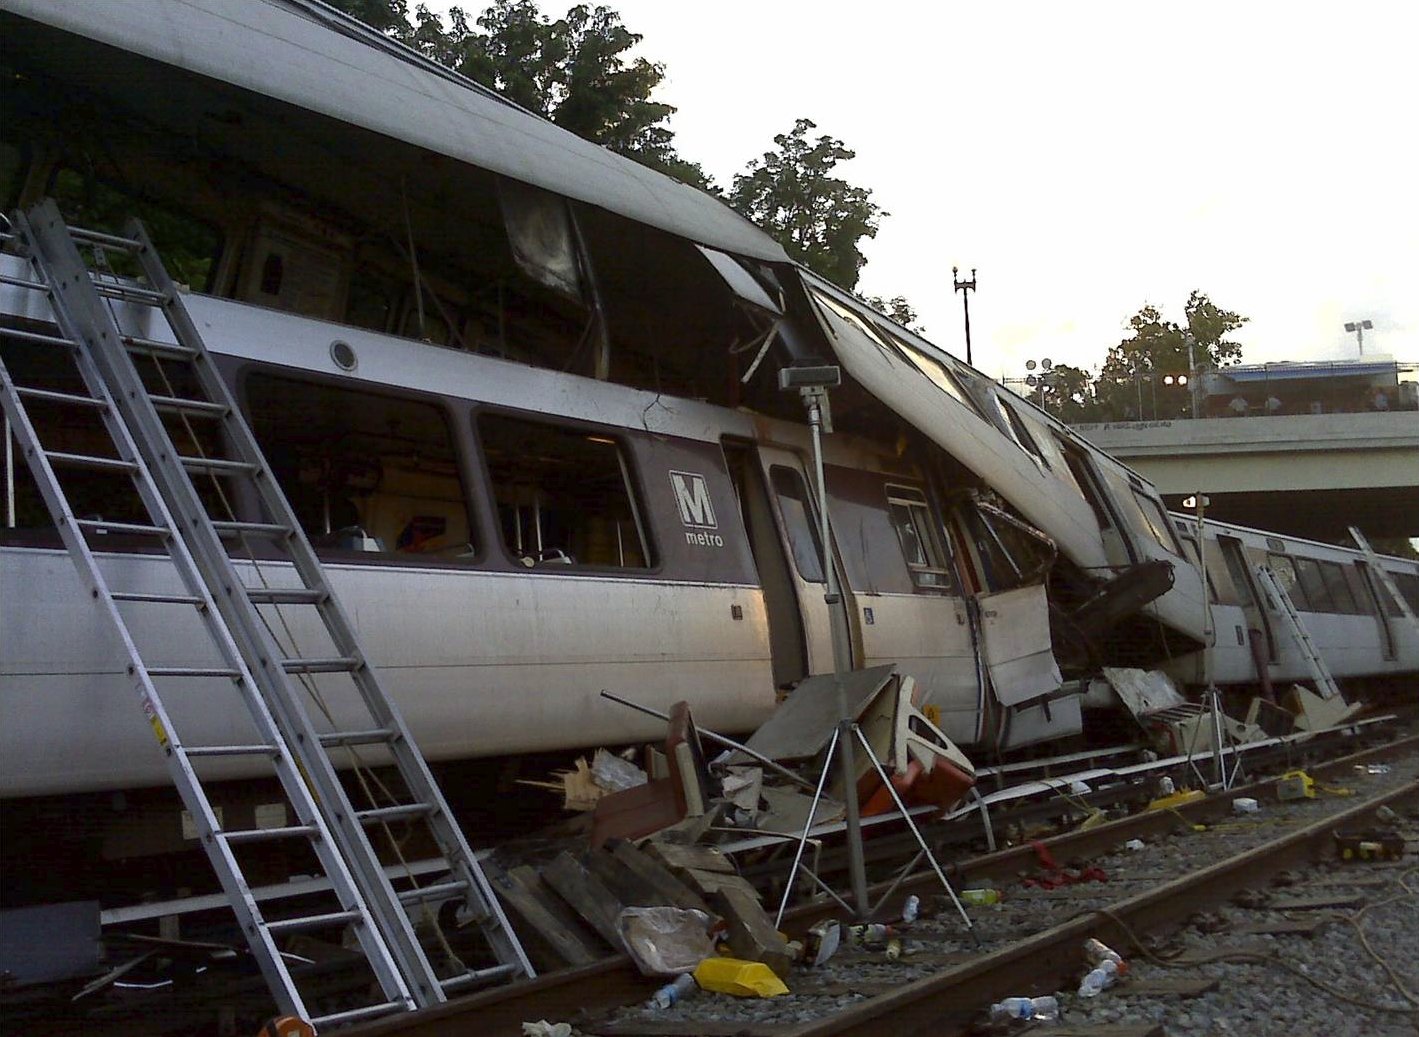
Fortunately, the NSTB also provided recommendations such as developing a non-punitive safety reporting program, establishment of periodic inspections and maintenance procedures for the equipment that failed during this accident, and reviewing the process used to pass along safety and technical information.  One of the important things to notice in this example is that the recommendations are fairly specific, even if the stated cause is a little vague.  Specific solutions are necessary if they are going to be effectively implemented.

If you find yourself at a point in your organization where a cause is identified as “lack of safety culture”, it’s a good idea to keep asking why questions until you identify the specific problems that are causing the issue.  Is it the safety information that is lacking or incorrect?  Is the process that provides the information confusing?  Do the workers need better safety equipment?  Knowing all the details involved will allow better solutions to be developed.  And better solutions result in lower risks in the future.  Culture is the shared values and practices of the people in an organization.  The Cause Mapping method of root cause analysis has an effective way for an organization to identify “culture gaps” by thoroughly dissecting just one of its incidents.

Spacewalk Delay for Ammonia Leak

By Kim Smiley

Astronauts at the International Space Station ran into problems during a planned replacement of a broken ammonia cooling pump on August 7, 2010.  In order to replace the pump, four ammonia hoses and five electrical cables needed to be disconnected to remove the broken pump.  One of the hoses could not be removed because of a jammed fitting.  When an astronaut was able to disconnect it by hitting the fitting with a hammer, it caused an ammonia leak.

Ammonia is toxic, so the leak impacted both the safety and environmental goals.  Because the broken pump kept one cooling system from working, there was a risk of having to evacuate the space station, should the other system (which was the same age) fail.  This can be considered an impact to the customer service goal.   The repair had to be delayed, which is an impact to the production/schedule goal.  The loss of a redundant system is an impact to the property/equipment goal.     The extended spacewalk is an impact to the labor/time goal.

Once we fill out the outline with the impact to the goals and information regarding the problem, we can go on to the Cause Map.   The ammonia leak was caused by an unknown leak path and the fitting being removed by a hammer.  The fitting was removed with a hammer because it was jammed and had to be disconnected in order for the broken pump to be replaced.  As we’re not aware of what caused the pump to break (this information will likely be discovered now that the pump has been removed), we leave a question mark on the map, to fill in later.

The failed cooling pump also caused the loss of one cooling system.  If the other system, which is near the end of its expected life, were to fail, this would require evacuation from the station.

To aid in our understanding of this incident, we can create a very simple process map of the pump replacement.  The red firework shows the step in the replacement that didn’t go well.  To view the outline, Cause Map and Process Map, click on “Download PDF” above.

Therac-25 Radiation Overdoses

By ThinkReliability Staff

The Therac-25 is a radiation therapy machine used during the mid-80s.  It delivered two types of radiation beams, a low-power electron beam and a high-power x-ray.  This provided the economic advantage of delivering two kinds of therapeutic radiation with one machine.  From June 1985 to January 1987, the Therac-25 delivered massive radiation overdoses to 6 people around the country.  We can look at the causes of these overdoses in a root cause analysis performed as a Cause Map.

The radiation overdoses were caused by delivery of the high-powered electron beam without attenuation.  In order for this to happen, the high-powered beam was delivered, and the attenuation was not present.  The lower-powered beam did not require attenuation provided by the beam spreader, so it was possible to operate the machine without it.  The machine did register an error when the high-powered beam was turned on without attenuation.  However, it was possible to operate the the beam with the error and the warning was overridden by the operators.

The Therac-25 had two different responses to errors.  One was to pause the treatment, which allowed the operators to resume without any changes to settings, and another was to reset the machine settings.  The error resulting in this case, having the high-power beam without attenuation, resulted only in a treatment pause, allowing the operator to resume treatment with an override, without changing any of the settings.  Researchers talking to the operators found that the Therac-25 frequently resulted in errors and so operators were accustomed to overriding them.  In this case, the error that resulted (“Malfunction 54”) was ambiguous and not defined in any of the operating manuals.  (This code was apparently only to be used for the manufacturing company, not healthcare users.)

The Therac-25 allowed the beam to be turned on without error (minus the overridden warning) in this circumstance.  The Therac-25 had no hardware protective circuits and depended solely on software for protection.  The safety analysis of the Therac-25 considered only hardware failures, not software errors, and thus did not discover the need for any sort of hardware protection.  The reasoning given for not including software errors was the “extensive testing” of the Therac-25, the fact that software, unlike hardware, does not degrade, and the general assumption that software is error-proof.  Software errors were assumed to be caused by hardware errors, and residual software errors were not included in the analysis.

Unfortunately the coding used in the Therac-25 was in part borrowed from a previous machine and contained a residual error.  This error was not noticed in previous versions because hardware protective circuits prevented a similar error from occurring.  The residual error was a software error known as a “race condition”.  In short, the output of the coding was dependent on the order the variables were entered.  If an operator were to enter the variables for the treatment very quickly and not in the normal order (such as going back to correct a mistake), the machine would accept the settings before the change from the default setting had registered.  In some of these cases, it resulted in the error described here.  This error was not caught before the overdoses happened because software failures were not considered in the safety analysis (as described above), the code was reused from a previous system that had hardware interlocks (and so had not had these problems) and the review of the software was inadequate.  The coding was not independently reviewed, the design of the software did not include failure modes and the software was not tested with the hardware until installation.

This incident can teach us a lot about over-reliance on one part of a system and re-using designs in a new way with inadequate testing and verification (as well as many other issues).  If we can learn from the mistakes of others, we are less likely to make those mistakes ourselves.  For more detail on this (extremely complicated) issue, please see Nancy Leverson and Clark Turner’s An Investigation of the Therac-25 Incidents.”

Tackling Injuries in the NFL

By Kim Smiley

It’s no secret that a lot of players get hurt in the National Football League (NFL).

But why does this happen?  Why do so many players get hurt?  And what may be a better question, is there a way to prevent injuries?

This problem can be approached by performing a root cause analysis built as a Cause Map using root cause analysis software you probably already own – Microsoft Excel.

The first step is to determine how the organizational goals are impacted.  In this example, the safety goal will be considered.  The safety goal is impacted because there is a potential for injury.  Causes can then be added to the Cause Map by asking “why” questions.

Why do football players get hurt? Football players routinely slam into each other and the ground. It’s the nature of football. Even when the rules are followed, football is a very physically demanding sport with a potential for injuries to occur.

Another reason players get hurt is that they are wearing inadequate protection to prevent injury. Right now the rules only require uniforms, helmets and shoulder pads.  Most players wear very little padding because they want to maximize their speed and mobility.

As a potential solution to this problem, NFL officials are reconsidering the rules that govern the pads worn by players. Currently knee, hip and thigh pads are only recommended, but there is possibility that this will be changed for the 2011 season.

Twelve teams will experiment with lightweight pads during training camps and preseason games this year.  The players will have the option to continue wearing the pads during the actual season if they want.

Depending on the outcome of the trials, there is the possibility that additional padding will be mandatory starting in the 2011 season.  Hopefully, the additional padding will be successful at preventing some injuries, but only time will tell.

Impure Injections Used

By Kim Smiley

Research is been suspended at a prominent brain-imaging center associated with Columbia University.  Food and Drug Administration investigations found that the Kreitchman PET (positron emission tomography) Center has injected mental patients with drugs that contained potentially harmful impurities repeatedly over the past four years.

Investigations by the lab determined that no patients were harmed from the impurities, but this is still a significant issue in a nationally renown laboratory.

How did this happen?

This issue can be investigated by building a root cause analysis as a Cause Map.  To start a Cause Map, the impact to the organization goals is determined.  In this example, this issue is obviously an impact to safety because there was potential to harm patients.  It is also an impact to the production-schedule goal because research has been suspended.  Additionally, this problem is an impact to the customer service goal because this issue raises questions about the validity of research results.

To build a Cause Map, select one goal and start asking “why” questions to add causes.  In this case, the first goal considered will be the safety goal.  There was a potential for injury.  Why?  Because impure injections were given to patients.  Why?  Because the injections are necessary for research, because the labs typically prepare the compounds themselves and because the lab prepared the compounds incorrectly.  When there is more than one causes that contributed, the causes are added vertically with an “and” between them.

Each impacted goal needs to eventually connect to the same Cause Map.  If they do not, the impacted goal may not be caused by the same problem and the goals should be revisited.

To continue building the Cause Map, keep asking “why” questions for each added cause until the level of detail is sufficient.

A Cause Map can be as high level or as detailed as needed.  The more significant the impact to the goals, the more likely a detailed Cause Map will be warranted.  Once the Cause Map is completed, it can be used to develop solutions to help prevent the problem from reoccurring.

In this example, the lab is currently changing management and reorganizing procedures to help prevent the similar problems in the future.

To view an initial Cause Map for this issue, please click the “Download PDF” button above.

Containment Cap Removed from Gulf Oil Leak

By ThinkReliability Staff

Last Wednesday, another set back occurred in the attempt to stem the flow of oil in the Gulf of Mexico from the a well head that was damaged when the Deepwater Horizon Oil Rig exploded on April 20 and sank 36 hours later .

The containment cap used to siphon oil from the damaged well head for the last three weeks had to be temporarily removed for more than 11 hours.  Before being removed, the containment system was sucking up about 29,000 gallons an hour.

So what happened?  Why remove a containment cap that had been working successful?

A root cause analysis of this problem can be built as a Cause Map.  A Cause Map is started by considering the impact to the goals and asking “why” questions to add Causes.  In this example, the first goal we will consider is the Environmental Goal.  Obviously, the environmental goal is impacted because there was additional oil released to the environment because the cap was removed.

Continuing to ask “why” questions we can add additional causes.  The cap was removed because the ship connected to the containment cap system needed to be moved away from the well because there a safety concern because of the potential for an explosion.

There was an explosion concern because there was evidence that flammable gas was flowing up from the well head because liquid was being pushed out of a valve in the containment system.  This gas was getting into the containment cap system because an underwater vent was bumped by one of the remote-controlled submersible robots being used to monitor the damaged well.

More detail could be added to the Cause Map by continuing to ask why questions.  The detailed Cause Map could then be used to develop solutions that could be implemented to help prevent the problem from reoccurring.

Click on the “Download PDF” button above to view an initial Cause Map.

The containment cap was put back into place around 9 pm on June 23.  The efforts to contain and clean up the oil spill will continue for months and possibly years to come, but at least this small issue has been fixed.

Mine Explosion in Colombia

By Kim Smiley

A coal mine explosion in Amaga, Colombia on June 16, 2010 has left at least 18 dead, 1 injured and at least 53 people unaccounted for, and presumed dead.  The deaths and injuries resulted from a fireball caused by an explosion.

Every explosion is caused by four factors: heat, fuel, oxygen and confinement.  In this case, the fuel was methane gas that had built up in the mine.  Methane is naturally produced as a byproduct of coal mining.  The methane was not removed from the mine because the mine lacked a methane ventilation pipe.  Additionally, the workers at the mine did not realize that methane levels were high because there was no gas detection system at the mine.

The number of dead and missing is so high because more people than usual were at the mine – the explosion happened during shift change.  Rescue efforts have been delayed by the high levels of gas in the mine, further increasing the number of deaths.

By clicking “Download PDF” above, you can view the thorough root cause analysis built as a Cause Map in a simple, intuitive format that fits on one page.

Even more detail can be added to this Cause Map as the analysis continues. As with any investigation the level of detail in the analysis is based on the impact of the incident on the organization’s overall goals.

UPDATE: Convictions Result from Bhopal Tragedy

By ThinkReliability Staff

In a previous blog, we outlined the two theories of a 1984 tragedy in Bhopal that resulted in approximately 15,000 deaths. On Monday, June 7, 2010 (nearly 16 years after the incident) 7 former Union Carbide senior employees were convicted of “death by negligence” by an Indian court.  The sentence was two years in jail and a fine of 100,000 rupees (just over $2,000 U.S.).  One former employee who was also charged has since died.  The Union Carbide subsidiary which owned the plant at the time of the leak was also ordered to pay 500,000 rupees as well.

Memorial for those killed and disabled by the toxic gas release.

The charges against the company and the senior officials had been reduced from culpable homicide by India’s supreme court in 1996.  The head of Union Carbide has also been charged but extradition requests remain outstanding.

The recent court case has highlighted not only the problems that led to the chemical leak, but problems that result in massive delays in the Indian court system.  The Law Minister has admitted the delay and said “We need to address that.”

Although the court did not release additional information with their ruling, this appears to support the theory that the an equipment or safety system failure (and not employee sabotage) caused the leak.

Recreational Water Illnesses

By ThinkReliability Staff

Last year we wrote a blog about preventing pool injuries, specifically slipping and drowning. However, there’s a lesser known risk from a pool – getting sick from swimming. This is officially known as “recreational water illness” or RWI, and normally involves diarrhea. RWI is estimated to affect approximately 1,000 people a year (according to WebMD) and can cause death, especially in immune-compromised people.

We can perform a proactive root cause analysis to determine what causes these illnesses. Essentially, a person consumes germs by ingesting pool water that contains germs. Pool water becomes contaminated when germs enter the pool from fecal matter. (Easier said than done. Did you know that the average person is wearing 0.14 grams of fecal matter?) So please, keep fecal matter out of the pool. Take a shower before you get in and make sure your kids are using the bathroom regularly elsewhere. (Not surprisingly, kiddie pools are the ‘germiest’.)

Now, pools are treated to prevent these germs from proliferating. However, some combinations of pool chemicals and germs take much too long to work to be effective. (For example, cryptosporidium takes 7 days to be killed in chlorine.) Some pools aren’t getting enough chemicals due to inadequate maintenance. And, there’s some stuff you can put in the pool – namely urine, sunscreen, and sweat – that interacts with chlorine and reduces the effective volume in the pool. So, even though urine itself doesn’t contain germs, don’t pee in the pool. And again, take a shower.

Our solutions to RWI – take a shower, don’t perform any bodily functions in the pool, and don’t swallow the pool water. However, that works for you and your family, but what about the unwashed masses in the pool? The CDC recommends you buy your own water testing kit and test the pool water before you get in. Make sure there’s a pool treatment plan and that it’s being followed, and that all ‘accidents’ are reported immediately. (Yep, even if they’re your fault.) Then lay back, relax, and enjoy your swim.

Multiple Beauty Salon Car Crashes

by Kim Smiley

On May 25, 2010, the National Highway Traffic Safety Administration (NHTSA) released new data about Toyota’s unintended acceleration issues, increasing the number of deaths potentially linked to the issue to 89.  Additionally, the NHTSA stated that nearly 6,200 complaints regarding acceleration issues in Toyotas have been received since 2000.

The acceleration issues have already resulted in massive recalls of Toyota vehicles in the US.  Nearly 5.4 million vehicles were recalled to fix issues with floor mats that could potentially shift out of position and an addition 2.3 million vehicles were recalled to repair sticking accelerator pedals.  No additional causes have been found for the acceleration issues at this time, but there are a wide range of theories that include electronic issues and solar flares.  Toyota denies that there are any additional causes of the acceleration at this time.

The US government is continuing to investigate the claims of unintended acceleration in Toyotas and an independent 15-month study by the National Academy of Sciences will begin in July.

A recent Wall Street Journal article discussed one of the stranger trends that have been found in the Toyota car crash data.  There have been an unusual number of accidents at beauty salons.

Why beauty salons?

Just like any problem, this issue can be investigated using a root cause analysis built as a Cause Map.  In this case, the Safety goal would be impacted because there is a potential for injury for both the driver and people inside the salon.  Additional causes can be added to the Cause Map by, asking “why” questions and adding boxes to the right.

In this example, the article speculates that the some of the potential causes may be the age of the drivers involved (older women tend to visit salons more frequently), location of the salons (many are in strip malls near parking lots) or the architecture of salons (many have large glass windows that might distract drivers).  No formal investigation has been done to determine the actual causes of this strange trend, but it is interesting to lay out the potential causes and see what factors might be contributing to the hair salon car crashes.

Click on the “Download PDF” button above to view the initial Cause Map.