Several Incidents at CA Nuclear Plant Raise Concerns

By Kim Smiley

Within a week, three separate incidents occurred at the San Onofre Nuclear Generating Station, located near heavily populated areas, raising new concerns about the safety of the nuclear power plant.

This issue can be investigated by building a Cause Map, an intuitive, visual root cause analysis.  The first step in building a Cause Map is to determine what goals are impacted by the issue being considered.  In this case, the main goal being considered is safety.  If the Cause Map was being built from the perspective of the power plant company, then the production and schedule impacts would also need to be considered, but in this example we will focus on the safety impacts.

The safety goal is impacted because some people are concerned about the safety of the power plant because it is near heavily populated areas and three separate incidents occurred within days of each other.  The three incidents in question were the release of a small amount of radiation, discovery of unexpected amounts of wear on steam generator tubes, and the potential contamination of a worker.

A small amount of radiation was released because a steam generator tube, which carries radioactive water, was leaking.  Luckily, the leak was small and the plant was quickly shut down after the leak was discovered so no significant amounts of radiation were released.  A second reactor unit is currently shut down for maintenance and inspection of the steam generator tubes found significantly more wear than expected on some of the tubes.  The wear was unexpected because the tubes have only been in service for 22 months and two tubes had 30% wall thinning, 69 tubes had 20% wall thinning and 800 had 10% wall thinning.  The situation is being investigated, but neither the cause of the wear nor the best course of action has not yet been determined.  The final incident was the potential contamination of a worker because he fell into a reactor pool.  According to media reports, the worker was trying to retrieve a flash light and lost his footing.

To view a high level Cause Map of this incident, click “Download PDF” above.  The Cause Map can be expanded as more information comes available so that it can document and illustrate as much detail as needed to evaluate the issues.

As it stands, both the reactor units with the steam generator tubes are shut down.  The unit that experienced the leak is shutdown pending investigation and any necessary repairs.  The second unit that had the unexpected wall thinning in the steam generator tubes is in a planned shutdown of several months while it is refueled and upgraded.  The plants will be brought back online once it’s determined safe to do so.

Prison Fire Kills 103 in 2009

By Staff

On February 9, 2009, a fire and explosion in a seriously overcrowded prison in Honduras resulted in 103 deaths and 25 injuries.  The fire was started from a short circuit from a overheated refrigerator motor, used to store soft drinks for the inmates.  The cell block – which has a capacity of 800 – contained 1960 inmates, their clothing, and their bedding materials.  This provided plenty of fuel for the fire.

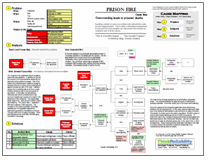
We can look at the causes that led to the prisoner deaths in a Cause Map, or visual root cause analysis.  We begin with the impacts to the goals.  The deaths and injuries of prisoners are an impact to the safety goal.  The environmental goal was impacted by the severe prison fire and explosion.  The customer service goal (considering the general population as the “customer” of a government-run prison) was unaffected, as there were no prisoner escapes.  Finally, the property goal was impacted due to damage to the prison.

We can continue the Cause Map by asking “why” questions.  The impacts to the goals were due to a severe prison fire and explosion.  In addition to the fire, the injuries to the prisoners was caused by the prisoners being unable to escape.  Part of the reason the prisoners were unable to escape is because they are in prison, and so precautions against escape are part of the deal.  However, egress from a building that is on fire to a safe location should be part of the procedures of any prison.  In this case, the procedures obviously didn’t work considering the high amount of deaths and injuries (of a total of 186 prisoners in this cell block).  The egress was likely made more   difficult due to severe prison overcrowding.  The prison has a capacity of 800 and contained 1,960 prisoners.  The increase in the prison population is at least partially due to a legislation passed the previous August which mandated a minimum 12-year prison term for gang members.  There are estimated to be more than 100,000 gang members in Honduras.

The heat for the fire was provided by an overheating refrigerator motor.  The fuel was provided by large amounts of clothing and bedding materials – more than usual, due to the prison overcrowding.

Once the causes for the impacted goals have been determined, solutions can be brainstormed.  In this case, prisoner advocates have been long calling for alternatives to jail sentences for gang members.  This would, of course, reduce the prison population.  Another option to reduce prison overcrowding would be to build more prisons.  To reduce the risk of fire, motorized equipment should be kept away from flammable objects, like clothing and bedding.  Last but not least, any facility has to have an effective egress plan in the case of fire or other emergencies.  These procedures are especially important in the case of a prison, where the potential of prisoner escape has to be considered as well as prisoner safety.

To view the root cause analysis investigation, please click “Download PDF” above.  Or click here to read more.

1960 Plane Collision over NYC killed 134

By ThinkReliability Staff

On December 16, 1960, two planes collided about a mile above Brooklyn, New York.  One plane – United Airlines Flight 826 – was in a holding pattern preparing to descend into Idlewild (now John F. Kennedy International) Airport.  The other plane – TWA Flight 266 – was preparing to descend into LaGuardia.  Since both airports serve New York City, they are in fairly close proximity.  The planes, too, were in close proximity – too close, leading to their collision.  In addition to the 84 passengers killed on the United flight (though one would survive for a day) and the 44 passengers killed on the TWA flight, 6 people were killed in the neighborhood of Park Slope, where the United plane landed.

This incident can be outlined in a Cause Map or visual root cause analysis.  We begin with determining the impacted goals.  First, the 134 total deaths were an impact to the safety goal.  The United flight crash resulted in a fire that affected more than 200 buildings, an impact to both the environmental and property goal.   The liability for the crash was assigned to both airlines and the government, an impact to the customer service goal.  There was another impact to the property goal because both planes were destroyed.  Lastly, the labor goal was impacted due to the rescue efforts of the more than 2,500 personnel who responded to the two crash sites.

These impacts to the goals occurred when both planes crashed after colliding.  The planes collided after their flight paths brought them into too close of proximity.  The United flight was estimated to be 12 miles outside its holding  pattern when the crash occurred, possibly because the ground beacon was not working.  The controllers at Idlewild were unaware of the plane’s position as planes were not tracked in holding patterns as it was too difficult to identify individual planes.  The planes were unaware of each other.  The visibility was extremely poor due to foggy, cloudy, sleety and snowy weather.  The United plane had lost the ability to use their instruments due to a loss of a receiver.  (The cause is unknown.)  Additionally, the controllers at LaGuardia (who were guiding in the TWA flight) were unable to reach the TWA plane to warn them of the close proximity of the United plane.

Although comprehensive details are not known about the crash, much of the information used to put together the investigation was obtained from the flight recorder (or “black box”).  This is now a main source of data in aviation accident investigations.  The evidence in this case was used to divide up liability for the accident very exactly – 61% to United Airlines, 24% to the US government and the remainder to TWA.

To view the Outline and Cause Map, please click “Download PDF” above.

Fatal Cruise Ship Accident

By ThinkReliability Staff

At least 11 people have been killed – with 24 still missing – after the cruise ship Costa Concordia ran aground on rocks near the island of Giglio, Italy.  The ship was taken  manually up to 4 miles off course on a route not  authorized by the company.

This incident can be thoroughly examined in a visual root cause analysis built as a Cause Map.  First, we examine the impacts to the goals for this incident.  The confirmed deaths and missing people are a significant impact to the safety goal.   Additionally, the environmental goal is impacted because of the potential for a spill of the 500,000 gallons of fuel still onboard.  The required evacuation of the ship can be considered a customer impact goal.  The loss of use of the ship – estimated to be $85 to $95 million for lost usage in the next year and the decrease in bookings due to concern over the incident can be considered an impact to the production/schedule goal.  The damage to the ship, which was recently built and insured for approximately $575 million, is an impact to the property goal and the rescue and recovery efforts are an impact to the labor goal.

Once we have these impacts to the goals, we can begin an analysis by asking “why” questions.  The impact to the safety goal – dead and missing passengers and crew – were caused by the ship running aground on rocks and  some issues with the evacuation process.  The ship ran aground on rocks because it got too close to the island in a manually programmed unauthorized deviation of the ship’s route, potentially to provide passengers with a better view.  This deviation in route, sometimes called a “fly by”, had been previously authorized by the company.  No crew members questioned the change in route by the Captain, noting that onboard he is solely responsible for the ship.  (Note that with great power comes great responsibility, and the Captain has been charged with manslaughter.)   Although the ship contains alarms meant to warn the crew when the ship goes off-course, these alarms are deactivated when the ship route is manually altered.

There were some issues with the evacuation of the ship, though as the company notes, not due to the evacuation procedure, which was externally reviewed in November.  Rather the issues were caused by the severe list of the ship (it was leaning almost completely to one side), which affects the ability to use the lifeboats.  Additionally, some of the passengers (who had just come aboard) had not yet completed a lifeboat drill.  The drill is required to be performed within 24 hours of boarding the ship and was scheduled for the morning after departure. The grounding occurred just 3.5 hours after departure.

Currently, rescue and recovery efforts continue.  Attempts are being made to remove fuel from the ship, which is in a protected area.  Concern about cruise ships in the area have previously been raised, with some wanting to limit ships that are allowed in the area.  Additionally, both the cruise ship company and the government are reconsidering the timing of lifeboat drills in order to ensure the best results for passengers in issues like these.

To view the Root Cause Analysis investigation, please click “Download PDF” above

Radioactive Release in the 1960s due to Inadvertent Dropping of Nuclear Weapons

By ThinkReliability Staff

In the history of nuclear weapons in the U.S., two accidents (or inadvertent drops) of nuclear weapons have resulted in widespread dispersal of nuclear materials.  These two incidents occurred two years apart, within a week.  The incidents had many similarities: in both cases, a B-52 bomber carrying nuclear weapons was damaged in air during an airborne alert mission and released nuclear weapons, which released radioactive material over a large area.  In both cases, there were significant impacts to the safety, environmental, customer service, property and labor goals.

Palomares: On January 17, 1966, a B-52 and KC-135 crashed during refueling above Palomares, Spain.  The KC 135 exploded, killing the entire crew of four.   The B-52 broke up mid-air, killing three crew members (four more were able to eject) and releasing four nuclear weapons.  Two of the weapons’ parachutes failed, and the weapons were destroyed, releasing radioactive material causing extensive cleanup of the 1,400 contaminated tons of soil and debris.  (Additionally, one of the intact bombs fell into the ocean and was not recovered for three months.) This was the third refuel of the mission and it’s unclear what exactly went wrong, though due to the close proximity required, mid-air refueling is extremely risky.

Thule: A fire began in a B-52 when flammable cushions were stuffed under a seat, covering the heat duct.  Hot air from the engine manifold was redirected into the cabin in an attempt to warm it up, which ignited the cushions.  The crew of the B-52 was unable to extinguish the fire and the pilot lost instrument visibility.  The generators failed (for reasons that aren’t clear), cutting all engine power.  The crew bailed, the plane crashed, and the two weapons were destroyed along with the plane, again releasing radioactive material that led to a four-month cleanup mission.

The causes of these two incidents have one thing in common – both resulted from planes carrying nuclear weapons as part of an airborne alert mission.  Although many safeguards were taken due to the high risk of the missions, extremely serious impacts still resulted.  Thus the decision was made to cancel airborne alert missions.  When the risk is too high, sometimes the only solution is to end the situation resulting in the risk.

We can look at these two incidents together in a Cause Map, or visual root cause analysis.  To view the Outlines,  Timeline and Cause Maps in a three-page downloadable PDF, please click “Download PDF” above.  Or click here to read more.

Number of Poached Rhinos Hits All Time High

By Kim Smiley

Rhinoceros, commonly called rhinos, have long been hunted for their horns.  Three of the five species of rhinos are considered critically endangered.  According to the National Geographic News Watch, at least 443 rhinos were killed in South Africa in 2011, a significant increase from 333 the previous year.  South Africa is home to more than 20,000 rhinos, which is over 90% of the rhinos in Africa.  For a little perspective on how significantly the problem has grown, South Africa only lost about 15 rhinos a year a decade ago.

Experts in the field have concluded that the number of rhinos lost through unnatural means, both illegal poaching and the less common legal hunts allowed by the government, will result in a decline in the population of rhinos.

This problem can be investigated by building a Cause Map, an intuitive, visual root cause analysis method.  To begin a Cause Map, the impact to the organizational goals is first determined and then “why” questions are asked to add Causes to the map.  In this example, the major organizational goal being considered is the impact to the environmental.  The environmental goal is impacted because the poaching of rhinos hit an all time high.  This happened because of two things, poachers want to hunt rhinos and the methods in place to prevent poaching are ineffective.

Poachers want to hunt rhinos because the black market value of their horns is extremely high.  They are worth more than gold by weight.  Poachers are able to sell the horns for high prices because consumers are both willing and able to pay huge sums.  There is a strong market for rhino horn because of long standing beliefs that rhino horn has medicinal uses, primarily in Asian cultures.  The number of people able to come up with large amounts of money has also increased with the rise of an affluent middle class in many Asian countries.

The poaching is also increasing because it’s very difficult to prevent it.  The rhinos live in a large, wild habitat.  It’s simply difficult and expensive to patrol and defend such a large region.  The poachers are very well armed because they are backed by international crime syndicates with deep pockets.  It’s a huge challenge for the governments involved to prevent the poaching from occurring.

This problem will likely continue to increase until the demand for the rhino horns starts to decrease.  Modern medical research has concluded that rhino horn has no medicinal value, but as long as people are willing to pay big money for them, someone will find a way to meet that demand.

As an interesting aside, theft of rhino horns from museums has also risen dramatically.  At least 30 horns were stolen from museums this past year.  Click here to learn more.

Driving While Distracted

By Kim Smiley

A recent study by the National Highway Traffic Safety Administration determined that 3,092 people died last year in car accidents that involved distracted driving.  This means that texting and talking on cell phones contributed to one out of every 11 traffic deaths in the US last year.

It’s difficult to compare this number to the findings from previous years because the definition for distracted driving was refined.  The number for 2011 included only the effects of texting and using a cell phone while driving while other non-technological distractions were included previously.

One thing that is clear, the popularity of texting is rapidly increasing.   196 billion text messages were sent in June 2011,  a nearly 50% increase from June 2009.

A Cause Map can be built to investigate this issue.  A Cause Map is a visual, intuitive form of root cause analysis.  To view a high level Cause Map of this example, click on “Download PDF” above.

One of the causes that contributed to this problem is that people aren’t pulling over when they need to use their cell phones while driving.  There are a number of reasons for this.  The first being, that pulling over is rarely convenient.  Second, people don’t see the need to pull over.  And third, whatever laws might be in place prohibiting distracted driving aren’t effective.

It isn’t clear why people don’t believe they need to pull over.  The study by the National Highway Traffic Safety Administration found that many people don’t think that cell phone usage and texting negatively affect their driving skills.  Many studies have determined that just isn’t the case.  Using a cell phone, either to talk or to text while driving will slow down a driver’s reaction time.   A study by the US Department of Transportation found that sending or receiving a text takes a driver’s eyes off the road for an average of 4.6 seconds.  At 55 mph, a car will travel the length of a football field in that time.

Following these findings, the National Transportation Safety Board (NTSB)  has recommended a nation wide ban on the use of all portable electronic devices, including cell phones.  This would include using a hands-free device to operate a cell phone. The only exceptions to the ban would be use of GPS systems and cell phone use in case of emergency.  Only time will tell what effect the NTSB recommendation has future laws.

Roofing Asphalt Spilled on PA Turnpike

By Kim Smiley

On November 22, 2011, a tanker truck spilled a large quantity of roofing asphalt along nearly 40 miles of the Pennsylvania Turnpike.  The spill damaged many vehicles and caused a traffic nightmare as crews worked for hours to clean the mess up.  The timing of this incident was also unfortunate because it occurred on the evening before Thanksgiving, traditionally a very high traffic time.

This incident can be analyzed by building a Cause Map, which is an intuitive, visual method for performing a root cause analysis.  The first step when building a Cause Map is to determine how the incident impacted the goals of the organization.  In this example, the safety goal was impacted because there was potential for car accidents and injuries.  Thankfully, no one was actually hurt, but it is important to note the potential impact in order to fully understand the ramifications from an event.  Additionally, the traffic delays are an impact to the schedule goal.  The customer service goal was also impacted because over 150 cars were damaged by the spill.

Now the Cause Map is expanded by asking “why” questions and adding Causes that contributed to the incident in order to show the cause and effect relationships.  In this example, there was a potential for injuries because more than 150 cars were damaged while driving.  The cars were damaged because they drove onto a spill of wet roofing asphalt.  The asphalt covered the cars and their wheels with thick, sticky goo and many of them undrivable.  The cars drove over the roofing asphalt because a tanker truck had leaked onto the road over a long distance.

The tanker truck was carrying a large load of the roofing asphalt, between 4,000 and 5,000 gallons, so there was a large quantity that could potentially be spilled.  Initial findings indicate that the tanker truck spilled the asphalt because of a leaking valve.  Details on why the valve leaked aren’t yet available, but they can be added to the Cause Map as they are known.

Another Cause of this incident is the fact that the driver of the truck was unaware that his truck was leaking so he drove almost 40 miles before he stopped and realized that there was a problem.    It was evening when the leak occurred so the driver wasn’t able to see evidence of a leak easily.

Media reports have stated that the driver of the tanker truck will be charged in the incident.  He is facing charges of failing to secure his load and failing to obey a trooper.  The website of the trucking company has posted a statement encouraging affected vehicle owners to file claims though their insurance.

Click on “Download PDF” above to view a high level Cause Map of this incident.

Pilot Locked in Bathroom Nearly Results in Terror Alert

By Kim Smiley

In order for a flight to take off and land safely, many complex mechanical systems have to work for the plane to function properly.  Additionally, pilots need to be properly trained and proficient at their jobs.  Airline processes also have to work in order to smoothly ticket, security screen and board all the passengers.

The number of things that have to work for a successful commercial airline flight is impressive.  A recent incident highlighted that even the smallest hiccup, a broken bathroom lock for example, has the potential to cause big issues in the complex world of commercial flights.

On November 18, 2011, a pilot accidentally got locked inside a bathroom just prior to landing at LaGuardia.  This incident almost resulted in an emergency being declared and terrorist alert being issued.  In order to understand this incident, a Cause Map can be built.  A Cause Map is a visual root cause analysis that illustrates the cause and effect relationship between all the Causes that contribute to an event.

In this example, the copilot considered declaring an emergency because the pilot was gone from the cockpit longer than excepted and an unknown man with an accent knocked on the cockpit door.  The copilot was concerned that this might be a potential hijacking attempt.  His concern was caused by the intended destination being NYC and the 9/11 attacks that occurred there 10 years ago.

The pilot was taking longer than normal because the bathroom door lock had jammed when he had tried to exit after a bathroom break.  The unknown man was a well-intended passenger who had heard the pilot calling for help.  The pilot had given him the password to access the cockpit because all other crew members were inside the cockpit.  There were two reasons that all other crew members were inside the cockpit.  First, regulations require that at least 2 crew members are inside the cockpit at all times.  Second this was a small airplane staffed with only 3 crew members.  If the pilot or copilot needed to use the restroom, the only flight attendant had to enter the cockpit to meet the rules.

Luckily, the pilot was eventually able to free himself from the bathroom and return to the cockpit before anything too exciting happened.  The plane landed as scheduled.  The FBI and Port Authority cops met the plane, but after briefly talking to the passenger involved it was quickly determined that nothing suspicious had occurred.

First Airline Fine for Tarmac Delay

by Kim Smiley

The Department of Transportation (DOT) recently issued the first fine for violating new rules that limit how long passengers can be kept onboard a plane waiting on the tarmac. The new regulations, commonly called the tarmac delay rule, state that passengers may not be kept onboard a plane waiting on the runway for more than 3 hours without being given the opportunity to deplane.  The rules also require that airlines provide adequate food and drinking water for passengers within 2 hours of a plane being delayed on the tarmac and to maintain operable lavatories.  The tarmac delay rule, which went in effect April 2010, was created following several incidents where passengers were kept onboard airplanes for long periods of time.

The incident that resulted in a fine is not the first violation of the 3 hour rule, but this is the first time the DOT has taken the step of issuing a fine.  The potential fees for violating the rules are substantial.  Airlines can be fined $27,500 per passenger when the tarmac delay is beyond 3 hours.  This quickly adds up, especially if multiple flights are involved.  In this example, 15 American Eagle flights were delayed beyond the 3 hour limit on May 29, 2011 at O’Hare International Airport in Chicago.   608 passengers were affected and American Airlines was fined a whopping $900,000.

What happened?  How were so many flights on the tarmac so long?

This example can be analyzed by building a Cause Map, a method for performing a visual root cause analysis.  A Cause Map is built by determining the cause-and-effect relationships between all the causes that contributed to an incident.  Click on “Download PDF” above to view a high level Cause Map of this incident.

As with many airline delays, inclement weather played a major role in this incident.  Flights had been delayed taking off from O’Hare and planes that were scheduled to have departed were still sitting at the gates.  Planes that landed had nowhere to go so they sat on the tarmac waiting for an open gate.

Passengers were not given an opportunity to deplane within 3 hours.  The airline has procedures to get passengers off the planes even if the planes themselves were stuck waiting on the tarmac, but the procedures were not implemented within the 3 hour time limit.  If there was no delay limit, an airline couldn’t violate it so the new creation of the tarmac delay role is also a cause to consider in this incident.

It will be interesting to see how this large, first of its kind fine affects the airline industry as a whole.   Statistics show that the new rules have successfully reduced long tarmac delays.  The first year that the rule was in effect, airlines reported only 20 tarmac delays of more than 3 hours, but in the 12 months prior to rule there were 693 delays of more than 3 hours.  But this improvement may come at a high cost.  Especially now that the DOT has shown that they are willing to issue fines, industry analysts are warning that a possible unintended consequence of the new tarmac will be more canceled flights.  The fines are so hefty that airlines may cancel entire flights rather than risk violating the tarmac delay rules, which would obviously have an impact on travelers.  Only time will tell how the new rules will affect airline travel.