Deadly Stage Collapse at State Fair

By Kim Smiley

On August 13, 2011, a stage at the Indiana State fair collapsed, killing seven and injuring dozens more.  The accident occurred just before 9 pm as a crowd waited to watch the popular country band Sugarland perform.

Why did the stage collapse?  What caused this tragic accident to occur?

This incident can be analyzed by building a Cause Map, an intuitive, visual format for performing a root cause analysis.  The first step when beginning a Cause Map is to determine what goals have been impacted.  In this example, the focus will be on the safety goal since there were fatalities and many injuries.  Once the impact is determined, the Cause Map is built by asking “why” questions to determine what causes contributed to the accident.

In this example, people were killed and injured because they were near the stage and the stage collapsed.  They were near the stage because they were waiting for a concert and the area had not been evacuated.  The area had not been evacuated because the decision to evacuate wasn’t made in time.  The decision didn’t happen in a timely manner because it wasn’t clear who had the authority to make the decision because there was not an adequate emergency plan in place.  The bad weather wasn’t a surprise.  The storm was being monitored and the National Weather Service had issued a warning, but the decision to evacuate wasn’t made until too late to prevent the tragedy.

Recently findings by investigators determined that the stage collapsed because it wasn’t up to code.  The structure was required to be able to withstand winds up to 68 mph, but the stage collapsed at winds below this limit.  Investigators determined that the lateral supports were inadequate and the stage wasn’t strong enough to stand up to the wind.  The stage also wasn’t inspected because it was a temporary structure and they are not required to be inspected.

On Tuesday, (April 17, 2012)  Indiana Governor Daniels reported that he has ordered temporary outdoor structures to be inspected by the Indiana Department of Homeland Security to help prevent a similar accident in the future.

To view a high level Cause Map of this incident, click “Download PDF” above.

Cleaning Up Aerosols May have Fueled Hurricanes

By Kim Smiley

A recent study by Britain’s Met Office weather service found that reducing pollutants in the atmosphere has had an unintended consequence, an increase in intense hurricane activity in North America.

A Cause Map, a visual root cause analysis, can be a helpful tool to understand this type of issue.  A Cause Map shows the cause and effect relationships between the different causes that contribute to an issue and can illustrate the potential consequence of changing one cause.

In this example, the problem is that hurricane activity has been increasing in the Atlantic Ocean.  Previous studies have found a link between a rise in ocean temperature and the increase in hurricane activity. Higher temperatures result in more intense hurricanes because there is more water vapor in the air because more water evaporates at higher temperatures.  More heat is released as the water vapor condenses into rain and this heat fuels the hurricane.

The surface temperature of the Atlantic Ocean has increased a small amount, about half a degree Celsius since 1970.  Scientists are not in agreement about the cause of this temperature increase.  Some people believe that the change is simply part of the natural long term variability of ocean temperatures.  Other scientists believe that global warming has caused the higher temperatures.  This new study adds a new dimension to the discussion.

The Met office study found that the reduction in aerosol pollutants in the air caused the rise in the ocean temperature.  Aerosols play a role because they affect the way clouds form.  More aerosols result in brighter, longer lasting clouds so reducing the aerosols in the atmosphere means that there will be fewer clouds over the ocean.  Fewer clouds mean that less sunlight is reflected away.  All this means that more sunlight will hit the ocean, increasing temperatures.

Fewer aerosols are in the environment because they cause acid rain and legislation was passed that limits how much can be released into the environment.

This issue is further complicated when the weather pattern is viewed on a global scale.  When the ocean temperature is cooler, there is less hurricane activity bombarding the United States, but then there are severe droughts in Africa.  Additional studies will be needed to confirm the findings on the effects of aerosol pollutants, but this new information is an interesting piece of the climate puzzle.

Siberian Plane Crash

By ThinkReliability Staff

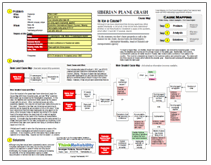
Four minutes after take-off on April 1, 2011, an ATR-72 crashed just past Roshchino International Airport in Tyumen, Siberia.  This type of plane has had previous issues with dealing with ice, and has been banned from flying in conditions likely to result in icing in the United States.  However, it has not yet been determined that ice was related to the crash.

To begin a Cause Map – an intuitive, visual root cause analysis – we look at the impacted goals.  In this case, the fatalities and injuries are the primary impact, to the safety goal.  Additionally, this incident, combined with previous air safety issues in Russia (such as the September 2011 crash that killed a Russian hockey team), have eroded public confidence in air safety in the country.  This could be considered an impact to the customer service and production goal.  The plane split into three pieces on impact, which affects the property goal.   Searches and subsequent investigations will likely impact the labor goal.

Once the impacts to the goals have been determined, begin the Cause Map with these impacted goals, and ask “Why” questions.  More detail can be added as the investigation progresses.  In this case, the fatalities and injuries were likely caused by the plane’s impact with the ground.  Other mechanical issues are still a possibility; however, the crew did not report any malfunctions prior to the crash.  Disruption of air flow over the wings and jamming of ailerons can be caused by accumulation of ice on the plane.  It has been determined that there was inadequate de-icing agent on the plane, either because it was not applied (according to the deputy head of the airport where the plane took off) or was not applied properly (according to the head of the Russian air transportation agency).  It is known that the weather was cold (the plane landed in a snowy field) and that ATR-72s have trouble with icy conditions, to the point where they have been banned from flying in conditions likely to cause ice in the US.

Officials aren’t ready to name the icing issues as a cause of the crash.  Further investigation will determine which causes did contribute.  In the meantime, all the information that is known can be captured on a Cause Map.  Causes can then be added – or crossed off – as more information becomes available.

To view the Outline and Cause Map, please click “Download PDF” above.

Combination of Gas Leak and Flare Could be Disastrous

By ThinkReliability Staff

A leak from the Elgin platform in the north sea near Aberdeen has the potential to cause an explosion due to the proximity of the leak to the still-lit flare on the platform.  However, the wind is currently blowing gas away from the flare.  The potential for environmental damage is not as great as that of Deepwater Horizon because it is a surface, rather than underwater, leak.

Workers on the now-evacuated Elgin rig noticed the leak on March 25, 2012.  The rig was partially, then later fully, evacuated.  We can examine the causes of the environmental leak, as well as the potential for further damage, in a visual root cause analysis in the form of a Cause Map.  The Cause Map lays out the cause-and-effect relationships in a clear, intuitive way.

We begin with the impacts to the goals.  The safety goal is impacted because of the potential for an explosion.  The environmental goal is impacted due to the gas leak, estimated to be approximately 200 cubic metres per day.  The customer service goal is impacted due to the loss of value of the owner corporation stock shares.  Production is currently shut down on the rig, leading  to an impact to the production goal.  The potential for an explosion could also cause catastrophic damage to the platform, which is an impact to the property goal.  Lastly, the evacuation of the platform is an impact to the labor goal.

In order for an explosion to occur, there must be fuel, oxygen, heat and confinement.  In this case, the oxygen is provided by the atmosphere, and the confinement is provided by the well itself.  The fuel is provided by the gas leak, believed to be entering from another non-producing well through a crack in the outer casing of the well, which was in the process of being plugged and abandoned.    The heat likely to cause the explosion is a flare on the platform.  The flare burns off excess gas from the platform and was not extinguished during the evacuation, as the priority was to remove the workers.

The flare is unable to be turned off remotely, but options for extinguishing the flare are being evaluated.  Other options being evaluated to stop the leak and reduce the potential for explosion include digging a relief well or killing the well that is currently leaking.  All options have the potential to be very expensive.

To view the Outline and Cause Map, please click “Download PDF” above.

School Leveled by Gas Explosion

By Kim Smiley

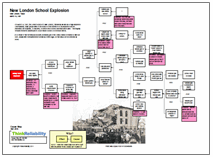
On March 18, 1937, the London School of New London, Texas was leveled by a huge explosion.  Unfortunately, many people were in the school on the afternoon of the explosion and an estimated 280 students, 15 teachers, 2 visitors and a school secretary were killed.  This tragedy remains the worst catastrophe to occur inside a school in American history.

The cause of this tragic incident can be investigated by building a Cause Map, a visual root cause analysis, which shows the cause and effect relationships between the different factors that contributed to the explosion.  A Cause Map begins by determining which goals were impacted and in this example the safety goal is the obvious focus.  Causes are then added to the Cause Map by asking “why” questions to add additional information.  In this example, the safety goal was impacted by the large number of fatalities.  The deaths occurred because the school was occupied and the school was destroyed.

The school was destroyed because there was a large natural gas explosion.  The explosion occurred because there was a large quantity of natural gas in the school and a shop teacher turned on a sander and created a spark.  The gas was in the school because there was a leak, there was a large quantity of gas was trapped in a void space under the school and the gas leak wasn’t detected.  The investigation into this incident was never able to decisively determine what caused the natural gas leak.  The void space was under the school because the school was built on a slope.  The leak wasn’t detected because the school was using untreated natural gas which is both invisible and odorless.

Why was the school using untreated natural gas?  The school was trying to save money by eliminating their heating bill.  The school was located near oil fields and had tapped into a nearby residue gas line to provide heat, saving approximately $300 dollars a month.  Using free untreated natural gas was a common practice in the region.  The gas company turned a blind eye since natural gas was considered a waste product of oil drilling that was just flared off.

The end result of using free, but untreated natural gas was that no one could detect that the school was filled with natural gas.  One spark and the whole school was destroyed along with many, many lives.

As a result of this horrendous accident, all natural gas in the United States is treated to have an odor, usually with mercaptan which smells like rotten eggs, so that leaks can be detected by smell.

Girder Fell on Car, Killing 3

by Kim Smiley

On May 15, 2004, a girder fell off an overpass and hit a car driving on the road below, killing all three occupants of the vehicle.  The National Transportation Safety Board (NTSB) investigated the incident to determine what caused the fatal accident.  The findings from the investigation can be used to build a Cause Map, a visual root cause analysis, which illustrates the causes that contributed to the accident.

In this example, the girder hit the car because it fell from an overpass and the car was driving on the road below it.  The girder was temporarily installed on the overpass because it was being used to add two additional lanes to the overpass.  The work was being performed at night in effort to minimize the impact on the heavy traffic that normally used the roads involved.  The workers believed the girder attached to the overpass was in a safe condition so they had opened the road beneath it to traffic.

The girder fell because it was inadequately fastened to the overpass.  The NTSB determined that the girder wasn’t installed plumb to the bridge and it was inadequately bolted to the bridge which allowed the girder to twist and ultimately fall.  The investigation also determined that the girder was inadequately fastened because the project wasn’t planned well.  The original work plan called for two girders to be spliced together and then fastened to the bridge, but a delay in work meant that the subcontractor was only able to get one girder up before the work was halted to allow the roads to be opened for morning rush hour.  (Weather delays postponed the work further and the single girder was fastened to the bridge for several days prior to falling.) There were also no Professional Engineers involved in the planning and no formal drawings created of how one girder would be fastened to the bridge.

The NTSB investigation also determined that the guidance that governed bracing was inadequate.  The language used was confusing and there was a lack of consistent standards.  The oversight of the contractor’s work was also inadequate since the inspector did not notice that the girder wasn’t secured adequately.

As a result of this investigation, the NTSB made several specific suggestions to revise bracing standards to improve clarity.

To view a high level Cause Map of this incident, click “Download PDF” above.

Deadly Train Collision in Poland

By Kim Smiley

On March 4, 2012, two passenger trains collided head-on near Szczekociny, Poland killing 16 and injuring 58.  It was Poland’s deadliest train crash in 20 years.

An investigation is underway to determine what caused the deadly accident, but an initial Cause Map can be built now and more details can be added as information becomes available.  A Cause Map is a visual root cause analysis format.  The first step in the process is to determine which organizational goals were not met and in this example the obvious goal to focus on is the safety goal.

The safety goal wasn’t met because there were fatalities and injuries.  This occurred when two trains crashed because they were traveling on the same track in opposite directions.  It’s not clear exactly how the trains ended up on the same track, but it appears human error was involved since prosecutors have announced plans to charge a controller for unintentionally causing the accident.  Media reports have also stated that the routing mechanism for one of the trains was set incorrectly so that it was sent down the wrong track and into the path of the other train.  As with any investigation that leads to human error, more information will be needed about why the mistake was made in order to fully understand why the accident occurred and determine what would be needed to prevent a similar one in the future.  In this case, we can also assume that the accident was caused by inadequate oversight of the controller or lack of a double check of the mechanisms because an ideal system won’t allow one single mistake to result in a deadly accident.

Another fact worth considering is that the rail system in Poland is in the midst of a massive modernization effort.  Poland’s rail system is being modernized to prepare for the huge crowds expected to travel to the Euro 2012 soccer championship this July.  The modernization effort has been possible in part because of subsidies offered by the European Union, which Poland joined in 2004.  As part of the modernization, more connections have been added and more trains have been running on the track where the accident occurred.  It isn’t clear yet if any of the changes contributed to the accident, but any recent changes to a system are worth reviewing during an accident investigation.

As more information is found during the investigation, the causes can easily be incorporated into the Cause Map to capture as much detail as needed.  To view a high level Cause Map, click “download PDF” above.

Cruise Ship Loses Power

By Kim Smiley

Part of the excitement involved in passenger cruises is access to remote areas of the world.  However, when a ship runs in to trouble, that remoteness can result in extremely difficult conditions.  This was the case on the Costa Allegra, which suffered an engine room fire in the Indian Ocean.

Passengers aboard the Costa Allegra experienced sub-standard conditions when the ship lost power and propulsion due to an engine room fire.  During the three days while the ship was being towed to land, there was no air conditioning, lighting, or running water.  Food and drinking water were provided by helicopter.

We can examine the causes and effects of this issue in a Cause Map, or visual root cause analysis.  With the Cause Mapping process, we begin by examining the impact to the goals.  Namely, when the incident occurred, which of the organization’s goals were not met?  In this case, although there appeared to be no injuries resulting from the fire itself (although some passengers may have become ill during the resulting conditions) there was the potential for severe injury resulting from the fire and then the lack of power that resulted.   Additionally, the customer service goal was impacted by the lack of running water, air conditioning, and lighting.  The schedule goal was impacted because the ship needed to be towed for 3 days.  The property goal was impacted due to the damage to the ship from the fire, and the labor goal was impacted due to the need for the ship’s crew to stand guard against pirate attack.

Once we’ve determined the goals that were impacted, we can use them as a basis for our map, and ask “Why” questions to add more detail.   Here, an engine room fire on the ship resulted in the loss of ship power, causing the loss of air conditioning, lighting and running water, and the loss of ability for the ship to propel itself, necessitating a tow.  The length of the tow is also affected by the type of ship doing the towing.  In this case, the first ship to arrive to the aid of the Costa Allegra was a fishing vessel.   Although tugboats later arrived, the Costa Allegra requested that the fishing vessel continue the tow, although it is believed that the tugboats would have been able to speed up the tow, possibly resulting in the ship arriving as much as 12 hours earlier.  The cruise ship company has stated that the tow was not changed in consideration of the consistency of the voyage for the passengers but there are also potentially financial considerations.  Assistance to people at sea is not paid, but assistance to ships is.  Thus, the fishing vessel actually entered into a contract with the cruise ship for the tow.

Part of the reason that a fishing vessel was the first to arrive is that there is little maritime traffic in the area.  This is due to the remoteness of the area in which the cruise ship was traveling, as well as the risk of piracy.  This, of course, led to a constant armed guard on the disabled ship to protect from potential pirate attack.

The location to which the ship was towed also impacts the length of the tow.  It was determined that smaller ports closer to the location of the disabled Costa Allegra could not accommodate the large number of passengers on the ship, so the ship was towed to an island of Seychelles.

The cause of the fire itself is still under investigation, although it is believed that an electrical fault is a likely cause and that arson is not likely.  As more information becomes available, we can add that information to the Cause Map as well.

To view the Outline and Cause Map, please click “Download PDF” above.

Honduran Prison Fire

By ThinkReliability Staff

How do you know when your solutions haven’t been effective?  When the same problem keeps happening.  Another prison fire claimed 360 lives in Honduras.  This is the third fatal prison fire in nine years, resulting from  chronic overcrowding and understaffing of Honduran jails.

Just more than 3 years since over 100 prisoners were killed in a prison fire  in San Pedro Sula (see previous blog), 360 prisoners (so far) have died as a result of a fire in Comayagua Prison.  (A fire in 2003 claimed the lives of 68 prisoners.)  An open flame has been determined to be the cause of the fire but contributing to the deaths is that the prisoners were unable to get out.

With any incident resulting in deaths of this magnitude, we can analyze the causes of the incident using a visual root cause analysis, or Cause Map.  We begin with the impacts to the goals.  In this case, the prisoner deaths were an impact to the safety goal.  In addition, prison overcrowding can be considered an impact to the production goal, and a delay in rescue can be considered an impact to the customer service.  Any damage resulting to the prison itself as  a result of the fire is an impact to the property goal.  Once we’ve determined the goals that were impacted, we can begin the analysis by asking “why” questions.

An investigation determined that an open flame (such as a cigarette or candle) and not arson, as was suggested prior to the investigation, caused the fire.  However, severe overcrowding (more than 800 prisoners were in a jail with a capacity of 500) and a delay in the rescue of the prisoners contributed to the massive death toll.

Honduras has a chronic overcrowding problem.  Honduras has a high rate of homicides and a high number of gang members.  Gang members receive strict sentences and, in many cases, are jailed prior to conviction.  However, an increased number of  inmates has not led to an increased number of guards.  On the night of the fire, there were 6 guards on duty.  Guards who were in the towers were not allowed to leave their posts to help with the fire-fighting and rescue efforts.  The guard who had the only set of keys fled prior to unlocking the doors.  (The guards are facing disciplinary actions.)  Firefighters were not allowed to enter the jail for 30 minutes after the fire call as the guards believed they were experiencing a riot or breakout.  An inmate who was not in his cell at the time of the fire was able to free many prisoners.

This incident has added more fuel to the international outcry over the state of Honduras prisons.   However, not much appears to have been done to improve conditions since the previous fires in 2003 and 2009, so it’s unclear if anything will change as a result of this fire.   It is certainly apparent that the safety of prisoners cannot be maintained with the current overcrowding and number of guards.  Additionally, procedures in the case of a fire certainly need to be improved to ensure that prisoners can be evacuated safely and securely.

To view the Outline and Cause Map, please click “Download PDF” above.

Collapse of Gulf of Maine Cod Population Feared

By Kim Smiley

Recent estimates of the Gulf of Maine cod population show that cod is being over fished to the point that the population is at risk of collapse, meaning the numbers become so low the population cannot recover.  Federal regulators are trying to determine the best course of action to protect the fish population which may include severely restricting cod fishing in the Gulf of Maine.

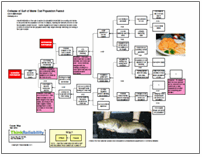
The declining cod population problem can be analyzed by building a Cause Map, an intuitive, visual root cause analysis.  The first step in building a Cause Map is to determine what goals are impacted by the issue.  In this case, the environmental goal is impacted because the cod population may collapse, but the economic impacts of this issue are also a major concern.

Cod has long been a major source of income for New England fishermen, bringing in $15.8 million in 2010.  Restricting cod fishing would also impact the ability to catch other fish because cod is often also bought up in nets when other fish are targeted.  Cod are bottom swimmers along with other popular fish such as flounder and haddock and it’s impossible to catch one type of fish without catching the others.

The cod population is declining because the fish are not reproducing fast enough to keep up with fishing. Fishing of cod occurs for several reasons.    First, cod is caught and sold because it is profitable.  Cod meat is high in protein, low in fat and easily filleted. Additionally, federal regulations allows fisherman to catch a set quota of cod.  One of the potential causes of the declining cod population may be that these quotas are set too high to for the cod population to continue to grow.

The federal limits on cod fishing over the past few years were set based on information from 2008 that showed a significantly higher cod population than the estimates determined by the recent population assessment.  It’s not clear why the numbers of cod varied so dramatically between the current estimates and the ones from 2008, but the dramatic swing in fish population estimates has been a source of many complaints by fishermen.  It may also be worth considering whether any environmental factors have impacted the fish population.  Cod population can be affect by many factors besides fishing, such as varying ocean temperatures or changes in their food supply.

After considering severe cuts of up to 82 percent, federal regulators appear to be willing to reduce the amount of cod allowed to be caught by only 22 percent for the 2012 fishing season.  This is only a one year agreement and fishermen will likely face severe cuts on cod fishing limits again in 2013.   At this time it’s not clear whether there is a way to save the historic fishing industry in the Gulf of Maine and ensure a healthy population of cod in the region.

To view a high level Cause Map of this issue, click “Download PDF” above.