All posts by ThinkReliability Staff

ThinkReliability are specialists in applying root cause analysis to solve all types of problems. We investigate errors, defects, failures, losses, outages and incidents in a wide variety of industries. Our Cause Mapping analysis method of root causes, captures the complete investigation with the best solutions all in an easy to understand format. ThinkReliability provides investigation services and root cause analysis training to clients around the world and is considered the trusted authority on the subject

Metro Train Derailment Washington D.C.

By ThinkReliability Staff

On February 12, 2010 at approximately 10:13 A.M., a six-car Red Line Metro train taking passengers to Shady Grove derailed near the Farragut North station in Washington, D.C.  If you’ve been reading our blog, you’ve seen our reports on three previous Metro incidents in the past year (two Metro workers were killed in January, two trains collided last November, and two trains also collided last June).

Thankfully, this derailment caused only minor injuries.  However, it did result in an extremely messy commute for a lot of people, due to a severe delay in train service.  Additionally, there was likely damage to the train and/or track, which will require labor to repair.  More labor will be required for the investigation.

All the basic information, as well as the impacts to the goals (the injuries, delay in service, property damage and labor required as a result of the incident), relating to this event are captured in a problem outline.  We can also capture anything that was different at the time.  Here we note that there were major storms in the area and that the commute was especially heavy.

Once we have completed the outline, we can begin the Cause Map with the goals that were impacted.  The impacts to the goals resulted from the train derailing.  The train derailed when the front wheels slipped and the lead car came off the track.  Metro and National Transportation Safety Board (NTSB) investigators are determining the causes of the derailment, but some of the things that will be looked at as causes include: the train was moving onto a pocket track.  Other trains previously have slipped off the track while moving onto a pocket track (a side track that allows trains to pass other trains or move around construction).  It’s unclear whether the train was moving onto the pocket track to move around other trains or track work.

As previously mentioned, the snow and icy conditions (which have been extreme as of late in D.C.) may have caused the tracks to be slippery, which potentially contributed to the derailment.  It’s possible there was damage to the tracks or switch, as the area where the derailment took place is the oldest portion of the Red Line, and is due for maintenance.  Because of an extreme budget shortfall on the Metro line, repairs to tracks and cars have been delayed.  Last but not least, there’s a possibility that the weight of the rail car may have been a factor in the derailment.  The cars were extremely crowded because of an insufficient number for the commute.  Metro was not running the normal number of cars because it had not completely recovered from the storm, but there were the normal number of commuters because the Federal Government was open.  (The Federal Government usually remains closed when the Metro system is unable to run at full capacity.)

Even though we are not yet certain which factors may have contributed to the derailment, we can include them all on the Cause Map until we are able to rule some of them out.  Even more detail can be added to this Cause Map as the analysis continues. As with any investigation the level of detail in the analysis is based on the impact of the incident on the organization’s overall goals.  View the beginning stage of the root cause analysis investigation by clicking on “Download PDF” above.

Traffic Monitoring Plane Makes Emergency Landing

By ThinkReliability Staff

Just before rush hour began on Monday, February 1, 2010, traffic was stopped for a different reason – a plane landed in the median and then skidded off the road.  Thanks to quick thinking and the exemplary control of the pilot, nobody was hurt, though the plane did suffer considerable damage.  As with any incident, we can look at what happened and the effects in a Cause Map, or a visual root cause analysis.

First we record the specifics of the incident, such as date, time, place, equipment and process involved.  There’s also space to write if anything was different, though in this case it’s not clear what any differences were, so we can just enter a “?” to show we’re not sure.

Next we define the incident with respect to the organization’s goals.  Although nobody was hurt, an emergency landing (especially when the plane is damaged) has the potential to cause injuries.  These potential injuries are an impact to the safety goal.  There was significant traffic back-up after the incident, which is an impact to both the customer service and the production/schedule goal.  Last but not least, the damage to the plane is an impact to the property goal.  It’s unclear whether there was an impact to the environmental or labor/time goal, so we’ll put a “?” here, too.

Once we’ve defined the impact with respect to the goals, we can begin with those impacted goals to make our Cause Map.  The impact to the safety and property goals occurred when the plane hit trees on the side of the road.  This happened because the rear wheel of the aircraft caught in the muddy median, where the pilot landed to avoid traffic, AND because the plane made an emergency landing on the New Jersey Turnpike.  (The emergency landing caused rubbernecking, which impacted the customer service and production goals.)  The plane required an emergency landing because it was losing altitude after the loss of an engine.  (The plane was in the air giving traffic reports.)  The engine was lost because it was losing oil from a leak in the right wing fuel tank.  It’s unclear what caused the leak at this time.  The pilot chose to land on the highway because it was well lit, unlike the surrounding areas and because the traffic was light since rush hour had not yet begun.

As you can see on the downloadable PDF, a thorough root cause analysis built as a Cause Map can capture all of the causes in a simple, intuitive format that fits on one page.  We can build a significant portion of the Cause Map even with the little information that is currently available.  Even more detail can be added to this Cause Map as the analysis continues. As with any investigation the level of detail in the analysis is based on the impact of the incident on the organization’s overall goals.  (Click on “Download PDF” to view the beginning of the root cause analysis investigation.)

Tragedy in Bhopal

By ThinkReliability Staff

While researching the tragedy in Bhopal, India, I discovered that there are two theories about what occurred on December 3, 1984 that resulted in a tremendous loss of life. One theory is from a report done by an Engineering Consulting firm hired by Union Carbide (the company that owned the plant in question) that determines that the release was caused by sabotage. Theory #2 is that a combination of inexperienced, ineffective workers and a badly maintained plant with inadequate safety standards that was being ready for dismantling experienced a horribly catastrophic chain of events that ensured that anything that could go wrong, did. For completeness, I have included both in my final Cause Map (which you can see by clicking “Download PDF” above). But for now, I’d just like to focus on the second.

In the wee morning hours of December 3, 1984, over 40 tons (this amount is also debated, but 40 tons appears to be the most popular, purely based on number of references that mention it) of methyl isocyanate (MIC) were released over the community of Bhopal, India, with a population of 900,000. Partially because of the transient nature of the population, and partially due to the general obfuscation of data from all sources involved, the number killed ranges from 2,000 to 15,000. The 2003 annual report of the Madhya Pradesh Gas Relief and Rehabilitation Department stated that a total of 15,248 people had died as a result of the gas leak. Based on claims accepted by the Indian government, there were at least 500,000 injured. This led to what has been called “The World’s Largest Lawsuit”, which I assume refers to the number of people represented, and certainly not the monetary amount of the settlement, which is a paltry $470 million. After the accident, the plant, after a series of legal maneuvers, was abandoned. Extensive cleanup was required, and still has not been completed. The impact to the goals are shown in the outline on the downloadable PDF.

The deaths and environmental impact were caused by the release of over 40 tons of methyl isocyanate (from here on out, we’ll refer to it as MIC). The release occurred when a large volume of MIC was put through an ineffective protection system. The release lasted several hours, because workers were unable to stop it, and because of an ineffective warning system. The release occurred when a disk and valve that led to the protection system burst due to an increase in pressure. The increase in pressure was caused by an increase in temperature resulting from a reaction between MIC and water when the refrigeration system was shut down. There were 41 metric tons of MIC in the tank, stored for use in the plant. How the water was introduced is the debate in the two theories I mentioned above. But regardless, water got in to the tank, either by sabotage or by leaking through a vent line. We will probably never know exactly what happened. But we do know that ineffective safety systems can result in a massive loss of life, as happened here.

Today in History: Fire on the USS Enterprise

By ThinkReliability Staff

On January 13, 1969, 31 years ago, fires and explosions broke out on the USS Enterprise (CVN-65). The crewmembers spent three hours fighting the fire. When the smoke cleared, 27 crewmembers were killed and 314 were injured. Additionally, 15 aircraft were destroyed and the carrier was severely damaged.

We can address the impacts to the U.S. Navy’s goals in a problem outline as the first step of the Cause Mapping process. There was an impact to the safety goal because crewmembers were killed and injured. There was an impact to the property goal because of the 15 planes that were damaged, and the repairs that were required to the ship. (This is also an impact to the labor goal, because of the labor required for the repairs.) Additionally, the ship’s deployment was delayed, which is an impact to both the customer service and production/schedule goals.

After we’ve completed the outline, we build our Cause Map beginning with the goals that were impacted. The goals were impacted by a series of explosions and fires across the ship. These explosions and fires were fueled by jet fuel and bombs that were found on the planes on the flight deck of the carrier. The initiating event was the explosion of a Mk-32 Zuni rocket, which exploded when it overheated due to being put in the exhaust path of an aircraft starting unit.
After the incident, the Navy performed an investigation to review the causes of the incident, and made changes to improve safety. Repairs to the Enterprise were completed, and the ship is now the oldest active serving ship in the U.S. Navy.

A thorough root cause analysis built as a Cause Map can capture all of the causes in a simple, intuitive format that fits on one page. To view the downloadable PDF, click “Download PDF” above.

More on the Disappearance of Flight 188

By ThinkReliability Staff

In our previous blog about Flight 188 of Northwest Airlines, we discussed the first step of a root cause analysis investigation – defining the problem – and mentioned that a detailed Cause Map could be developed when more information regarding the incident was released.

The National Transportation Safety Board (NTSB) has recently released a report on what exactly happened to the flight. We can build off of the outline we already developed to put together the Cause Map, or visual root cause analysis.

First we begin with the impacts to the goals. Most importantly, the safety and property goals were impacted due to the potential danger to the flight. This was caused by the plane overshooting the destination. The pilots flew over the destination because they were distracted, warnings were not effectively delivered to them, and they couldn’t see their destination (Minneapolis-St. Paul), since it was after dark and cloudy.

The pilots were distracted by a non-operation activity. The two pilots were utilizing the scheduling software on their laptops, both of which were open in the cockpit (possibly blocking some of the flight display). Both using personal laptops and participating in non-operational activities is prohibited by the airline.

Some may ask how it’s possible that two pilots who were flying a plane – with over a hundred passengers – could be spending all their energy on another activity. Well, the pilots did not actually have any active tasks to fly the plane. The plane was on auto-pilot, and the one task that pilots ordinarily did on a regular basis (which would have certainly alerted the pilots to their position) was sending a position report. However, a dispatcher for the airliner had asked the pilots NOT to send a report, as the reports were burdensome and unneccessary.

Warnings did not effectively get through to the pilots by sight – either the flight display was physically blocked by the laptop or the pilots weren’t looking at it because they were distracted – or sound – the plane was not equipped to send audible message (such as chimes or buzzers) to the pilots, text messages sent to them were not acknowledged, and the pilots did not hear calls for them on the radio. The air traffic controllers (who were different from the air traffic controllers who had first had contact with the plane) did not know which frequency the plane was on, so only some messages got through. Because the pilots were using the speaker instead of headsets and were, again, distracted, they missed the messages.

Both of the pilots involved had their licenses revoked. Several procedures were not followed in this instance, and the FAA and individual airlines are working on highlighting the importance of these procedures. Reading about this incident (and seeing that the pilots’ license were revoked) will probably do much to highlight the importance of the procedures. Luckily, nobody was hurt for this lesson to be learned.

View the root cause analysis investigation by clicking “Download PDF” above.

Airlink Incidents: Viewing Trends in Visual Form

By ThinkReliability Staff

Over the past three months, South Africa’s Airlink airline has had four incidents, ranging from embarrassing to fatal. Four similar incidents such as these start to point out a trend, which should be investigated to improve processes and increase safety. But how do we start the investigation?

In the Cause Mapping root cause analysis method, we begin by defining the problem. Here we can define four problems, which are the four incidents over the last three months. We can look at one incident at a time in a problem outline, the first step of the Cause Mapping process. We’ll start with the earliest incident first.

On September 24, 2009 at approximately 8 a.m. a Jetstream 41 crashed into a school yard in Durban Bluff just after take-off from Durban International Airport. This was a forced landing necessitated by the loss of an engine. The pilot was killed. There were also two serious injuries of the crew, and a minor injury of a person on the ground. There were no passengers on the plane, and the impact to Airlink’s schedule is unclear. However, the plane was lost.

We can capture this information more clearly and succinctly in an outline. For example, the above paragraph has more than 80 words. The outline, which records the same information, uses only 42 words in an easily understandable visual form. (The outline for all three incidents can be viewed by clicking on “Download PDF” above.)

The second incident: On November 18, 2009 at 1:30 p.m. a BAE Systems Jetstream 41 aborted take-off for East London and slid off the runway at Port Elizabeth airport. There were high velocity cross winds, and the pilot may have been unable to establish directional control. There were no injuries, no environmental impact and damages to the plane are unknown. However, new travel arrangements had to be made by the airline for all the passengers. The frequency of Airlink incidents is now two in eight weeks. (Over 80 words; the outline has 49 words.)

The third incident: On November 24, 2009 at approximately 8 a.m. a flight en route to Harare carrying a Prime Minister was forced to return to Johannesburg Airport after it experienced a technical fault. There were no injuries, but it caused a delay in the Prime Minister’s schedule. The damage to the airplane is unclear. The frequency of Airlink incidents is now three in two months. (Over 60 words; the outline has 33 words.)

The fourth incident: On December 7, 2009 at approximately 11 a.m. a Regional airline SA Airlink Embraer 135 commuter jet hydroplaned and overshot the runway while landing at George Airport during rainy weather. There were five injuries, including a sprained ankle. This incident has led to a poor public perception of the airline and increased supervision from the authorities. We do not have a dollar amount on the property damage. The frequency of Airlink incidents is now 4 in 10 weeks. (Over 70 words; the outline has 42 words.)

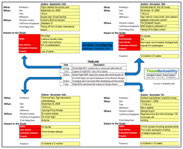
In addition to the increased brevity of the outline, it provides an easy visual comparison of the four incidents by showing them in a similar visual form. On one page, we can show the timeline, and outlines of the four incidents for easy comparison. This is especially useful for a briefing tool for busy managers.

Another Train Collision for the Washington D.C. Metro

By ThinkReliability Staff

In the early morning hours of Sunday, November 29th, after the Washington D.C. Metro shut down for the night, train 902 pulled into the West Falls Church station for cleaning. However, instead of stopping just behind the parked train already on the tracks, it rammed into it.

We can put this incident into a Cause Map, or a visual form of root cause analysis. A thorough root cause analysis built as a Cause Map can capture all of the causes in a simple, intuitive format that fits on one page. The first step in the Cause Mapping process is to outline the problem. After entering the “what, when and where” we frame the incident with respect to the Washington Transity Authority’s goals.

The operator, plus two other employees who were on the parked car cleaning, suffered minor injuries. This is an impact to the safety goal. The train cars, however, suffered extensive damage. Three of the cars will have to be replaced (at a cost of $3 million per car) and the extent of the damage to the other 9 cars involved is unclear. These are both impacts to the property goal. There may have been other goals that were impacted, but these are the main concerns.

West Falls Church-VT/UVA station, photographed by Ben Schumin on July 28, 2001

The second step of the Cause Mapping process is the Cause Map itself, or the analysis of the problem. To fill out the Cause Map, we begin with the goals that were impacted and ask why questions. The injuries and damage were caused by the parked train being struck by a moving train. The moving train was not stopped in time because the automatic train control system was not on (it’s not used in the railyard) and the speed suddenly increased, OR the operator wasn’t paying attention. (We don’t know yet, at this point of the investigation.)

Another train operator has come forward to say that this type of car suffers from power surges at low speeds (such as speeds used in the rail yard), which could have caused the speed to suddenly increase. We add this information to the map, and also add an evidence box showing where the information came from. This can be invaluable when sorting through a lot of information.

Although it is known that the operator had surpassed a ten-hour shift, it’s not known if fatigue or other causes of inattentiveness were involved. A union representative has asserted that the training program was unsatisfactory, which may have also played a part. As the National Transportation Safety Board (NTSB) and the Transit Authority continues their investigation, more detail can be added to this Cause Map as the analysis. As with any investigation the level of detail in the analysis is based on the impact of the incident on the organization’s overall goals.

Barge Grounds Off Virginia Beach

By ThinkReliability Staff

At approximately 11:00 p.m. on October 12th, 2009, the two 500,000 lb strength towlines connecting La Prinsesa barge to its tug broke free.  The tug was unable to recapture the ship, and it drifted for about seven hours in heavy seas caused by a wind-driven rain storm before grounding at Sandbridge Beach in Virginia, just shy of the Sandbridge pier.

So far the 84 hazardous material (HAZMAT) loads the barge was carrying appear to be intact.   There were no injuries, as the barge was unmanned.  Damage to the ship is not known at this time.   However, the incident had the potential to cause injuries, a HAZMAT spill that could have led to an evacuation, and far more damage to the ship and the beach.  The incident did lead to the loss of the towlines, which are valued at approximately $70,000 and a delay in the barge’s arrival.

It’s unclear what caused the towlines to break free.  Initial solutions are to clear the area and ballast the tug to attempt to keep it from drifting.  On November 17, the barge began being towed to open waters where the cargo can be off-loaded safely. However, long-term solutions that would prevent another incident of this type will only be determined after the causes of the issue are determined.

Click on “Download PDF” to view a PDF showing the root cause analysis investigation based on what is known  so far.  A thorough root cause analysis built as a Cause Map can capture all of the causes in a simple, intuitive format that fits on one page.  Even more detail can be added to the Cause Map as the analysis continues. As with any investigation the level of detail in the analysis is based on the magnitude of the impacts (or potential impacts).

How to Determine Your Organization’s Goals

By ThinkReliability Staff

The first step of the Cause Mapping strategy of root cause analysis is to define the problem with respect to the organization’s goals.  In order to do this, you need to know what an organization’s goals are.  While we provide Cause Mapping root cause analysis templates that will give you an idea of where to start, your organization may wish to personalize their investigations so that they correspond to your particular goals.

To define your organization’s goals, try to imagine a perfect day for your organization.  No matter what industry you’re in, that perfect day doesn’t include anyone getting hurt or killed.  This is the safety goal.  However, if your organization regularly is responsible for the health and welfare of people other than your employees, you may wish to have more than one category of safety.  For example, a hospital may have both “patient safety” and “employee safety” goals.  A public school may have “student safety” and “employee safety” goals.

Another goal generally common to all industries is the goal of not impacting the environment.   However, some industries have a base level of environmental impact, so their goal might be to not surpass that level rather than having no impact.  Environmental impacts usually result from leaks or spills of any material other than water, but may also result from improper storage or disposal of hazardous material.

Some organizations may have as a goal to meet regulatory requirements.  If an organization has an OSHA (Occupational Safety and Health Administration) reportable injury, this is an impact to the “Regulatory Compliance” goal.  Organizations may also have a “Compliance” goal if they are subject to another governing body, such as a trade group or an external accreditation.

Organizations usually exist to provide either products, services, or both.  If an organization provides products, a goal of that organization may be to get a set amount of products produced and delivered on a certain schedule.  We call this the “Production/Schedule” goal.  An organization that provides services wants to ensure that its customers are satisfied with the services they provide.  This is the “customer service” goal.  Many organizations will use both goals to define a problem.

Another area of concern for almost all organizations is cost.  An incident that requires additional labor, rework, or lost product results in unplanned costs for the organization.  We call this goal the “material and labor goal”.  If an incident results in many costs, it’s possible to itemize them within the problem outline.  Quantifying all the costs associated with an incident can help prioritize which incidents require the most immediate attention.  It also provides a bound for the cost of solutions – installing a $100,000 machine to solve an infrequent $20,000 problem doesn’t make sense.  (Of course, for incidents that involve impacts that can’t be easily quantified – human safety, regulatory requirements, customer service, etc.  – these impacts must be considered above and beyond the “cost” of the incident.)

Once you’ve determined all of the goals that are meaningful to your organization, you’re ready to make an outline for the first step of the Cause Mapping method of root cause analysis – define the problem.  But what order do you put the goals in?  Generally, the goals go in order from most to least important.  The safety goal is almost always at the top.  Your organization’s mission statement is an excellent resource to determine the order of the goals.  Ideally, they’ll follow along with your mission statement, with any goals not specifically called out (such as the “material and labor” goal) listed below.  It’s also possible to use a different order so that the biggest impacts from an incident are listed at the top.  However, your organization may prefer to always use the same order for consistency.

If an incident resulted in no impact to one of your organization’s goals, don’t delete the goal from the problem outline.  Instead, write “N/A” next to the goal.  That way, it’s clear that the goal was considered but it was determined that there was no impact.  Deleting the goal may lead others to believe that it’s no longer a goal of the organization!

Check out our examples to see a problem definition in action!

ThinkReliability has specialists who can solve all types of problems. We investigate errors, defects, failures, losses, outages and incidents in a wide variety of industries.  Contact us for investigation services and root cause analysis training.

Damage to the San Francisco-Oakland Bay Bridge (Again)

By ThinkReliability Staff

In a previous blog, I wrote about the impressively quick repairs to the San Francisco-Oakland Bay Bridge.  These repairs allowed the heavily-traveled bridge to reopen only an hour and a half late from scheduled repairs, despite unexpectedly finding a cracked eyebar during that time.

However, during evening rush hour on October 27, less than 2 months after the eyebar repair had been completed, two metal rods and a 5,000 pound metal beam fell onto the roadway.  The items that fell were part of the previous repair, which was supposed to have lasted until the new bridge opened in 2013. Although only one motorist was injured, other injuries or even fatalities were possible, and the damage to the bridge necessitated repairs and closing the transportation route for 280,000 cars a day for more than 5 days.

The “cause” given for the failure of one of the rods (which snapped, leading to the falling of the other rod and the beam) was fatigue caused by high (over 30 mile per hour) winds.  However, an adequate repair would have been able to withstand less than 2 months of traffic and 30 mile per hour winds, so the rod failure must have been caused by the combination of the high winds and an inadequate repair.

Given the speed with which the repair was completed (see our previous blog), it’s possible that the repair job was rushed.  Additionally, the Federal Highway Administration did not inspect the bridge after the repairs were completed, instead relying on state inspection reports.  Had another agency inspected the repairs, it’s possible the problems with the repair would have been noticed and fixed before the bridge was re-opened.

A summary of the investigation to date can be found on the downloadable PDF.  (To open, click on “Download PDF” above.)  The investigation includes a timeline, which can aid in the understanding of this issue, the problem outline, and the Cause Map (visual root cause analysis).  A thorough root cause analysis built as a Cause Map can capture all of the causes in a simple, intuitive format that fits on one page.  As with any investigation, as more information becomes known, more detail can be added to the Cause Map.