All posts by Angela Griffith

I lead comprehensive investigations by collecting and organizing all related information into a coherent record of the issue. Let me solve a problem for you!

Italian Train Explosion

Download PDFDownload PDFBy ThinkReliability Staff

On the evening of June 29, a train carrying liquefied natural gas derailed and exploded in the town of Viareggio, in western Italy.  Search and rescue operations are still ongoing, and the cause for the derailment is not yet known.  Although that means we are lacking some information, we can still begin our root cause analysis investigation, in the form of a Cause Map.  A thorough root cause analysis built as a Cause Map can capture all of the causes in a simple, intuitive format that fits on one page.

The benefit to beginning a root cause analysis investigation before all the information is known is to provide a framework for the investigation to build on.  People find it much easier to comment on a partially finished Cause Map than to piece together the investigation from scratch.

A root cause analysis template is available for download from the Think Reliability web page to assistant with the investigation.  The first step is to fill out the outline.  Don’t leave any blanks in the outline; if you don’t know something, put a question mark.  The first line is the ‘what’ or the problem.  Rather than spending time debating what ‘the problem’ is, we can put a number of things.  For example, the problem here could be defined as a gas leak, an explosion, and a train derailment.  We put all these things on the problem line.  The rest of the information is known, though we may add more detail later, except for differences.  Differences can be key to an investigation.  For example, if you have a process that works for 30 straight sunny days, then fails the day it rains, it is worth looking into the impact of the rain on the process.  Here, no differences are immediately coming to mind, so we’ll put a question mark in this blank.

Once we’ve defined the problem, we can define the problem with respect to the impact to the goals.  We don’t know how many people, overall, were killed or injured, but we can just put “at least” to show that the numbers aren’t exact.  We know that the environmental goal was impacted, because of the gas leak, the community goal was impacted because of the required evacuation, and the material/labor goal was impacted because of the collapsed houses, and the damage to the train.

Now we begin the analysis.  We begin with the impacted goals and ask “why” questions, moving to the right.  When we can’t answer the “why” question, we can use a question mark, or put some possibilities (theories) that have been presented.  For example, we’re not yet sure why the train derailed.  Some of the possibilities that have been presented are damage to the tracks, a problem with the braking system, or malfunctioning wagon locks.  The Cause Map (so far) is shown in the downloadable PDF (to download, click “Download PDF” above.)  As you can see, there is a lot of information present, even though we don’t know all of what happened yet.

As more information is available, we can update the Cause Map.  As with any root cause analysis, the level of detail in the analysis is based on the impact of the incident on the organization’s overall goals.

D.C. Metro Train Collision

Download PDFBy ThinkReliability Staff

On June 22, 2009, the Washington, D.C. area suffered its first fatal Metro train crash since 1982.  A transit train smashed into another train that was stopped on the tracks.  There has been an apparent increase in crashes in large city’s transit systems over the last several months, causing some to question whether enough is being done to ensure an attitude of safety.  Robert Lauby, a former NTSB investigator, said:

“Just because you had them doesn’t mean there’s a specific issue that caused them.”

Actually, that’s exactly what it means.  If something happens (an effect), there has to be a cause.  Usually there’s more than one cause.  We can look at this incident in a root cause analysis to determine what some of the causes were.  A thorough root cause analysis built as a Cause Map can capture all of the causes in a simple, intuitive format that fits on one page.

The official investigation is still in its infant stages, but we can still put together a pretty thorough Cause Map.  (See the Cause Map by clicking on “Download PDF” above.)  We can add more detail to this Cause Map as the investigation continues. As with any investigation the level of detail in the analysis is based on the impact of the incident on the organization’s overall goals.
First we define the problem.  Here, it’s that two trains crashed.  We also enter the other identifying information (date, location and process.)  Then we frame the problem with respect to the impacts to the goals.  Here, the safety goal was impacted because at least 9 people were killed and at least 76 were injured.  The material goal was impacted because of severe damage to the trains.

Next, we do the root cause analysis.  We begin with the impacted goals and ask “why” questions to find all the causes of the incident.  People were killed and injured because of the damage to the trains.  The trains were damaged because of a train, which was moving at a “considerable speed”  rear-ending a stopped train, and because of the  inadequate crashworthiness of the moving train.

The train was not adequately crashworthy because it was old, and not replaced (despite an NTSB recommendation to replace or retrofit the older cars to increase safety in a crash).  Why weren’t they replaced?  We don’t know yet, but the NTSB will be talking to Metro’s administration to find out.

The two trains collided because the train that was rear-ended was stopped on the tracks, waiting for another train to move.  The train that struck it did not stop or slow down.  The striking train was not equipped with a data recorder and the operator was killed in the incident, so we don’t have a very good idea of what happened.  But we can come up with some theories and then refine or reject them as evidence permits.  Since the train didn’t stop, it’s either because there was no attempt to stop, or the braking system malfunctioned.  From the information we have available, it appears that a train would not attempt to stop if the operator was unaware of the train, because she couldn’t see it and because the sensor system was not working properly,  AND if the mechanical override system was not working.  The sensor system not working might cause the mechanical override system to not work, OR the system could have been overridden by either the dispatcher or the operator.  (Apparently having the train in manual may turn off the mechanical override.)

We can continue to add to our root cause analysis as we get more information on the accident.

Preventing Runway Incursions at LAX

Download PDFBy ThinkReliability Staff

Enterprising companies know that finding new, effective solutions to problems makes good business sense.  Finding new solutions can be the difficult part.  A root cause analysis can help find new, effective solutions.  To demonstrate this capability, we’ll look at the problem of runway incursions at Los Angeles International Airport (LAX).  In 2007, there were 21 incursions at LAX.  Perhaps the problem was discussed, and it was determined that one of the causes of these incursions was that the taxiways intersected the runways.  This is shown below in a Cause Map, or visual root cause analysis.

Runway CM1

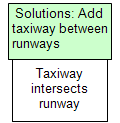
A potential solution, then, is to install a taxiway between the runways, so that they don’t intersect.

Runway CM2

This solution has been implemented at LAX, with the result of runway incursions dropping to 5 so far this year.  However, LAX officials would like that number to fall even further.  So they started looking for new solutions.  Finding new solutions may mean adding more detail to the Cause Map.  For example, what if we add another cause for runway incursions?

Runway CM 3

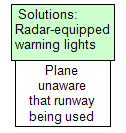
This gives us another cause that we can try to “solve”.  Here, the solution being implemented at LAX is radar-equipped warning lights.  Essentially, if the system senses a plane or vehicle that could lead to a potential collision on a runway or taxiway, the runway lights turn red.  If not, they are green.  The plane still has to request clearance from traffic control, but it adds another layer of protection.

Runway CM 4

Officials at LAX hope this will continue to decrease the number of incursions at LAX.  If not, the root cause analysis can be built into even more detail, and more solutions can be found.

Loss of submarine KURSK

Download PDFBy ThinkReliability Staff

On August 12, 2000, a torpedo exploded on KURSK, leading to the eventual loss of the submarine and all on board.  We can demonstrate the causes of the KURSK tragedy by performing a visual root cause analysis, or Cause Map.  A thorough root cause analysis built as a Cause Map can capture all of the causes in a simple, intuitive format that fits on one page. First we define the problem(s).  Here, the problems include a torpedo explosion and submarine sinking.  This is the “what”.  The initial explosion on KURSK ocurred at 11:28 a.m. on August 12, 2000.  This is the “when”.  The KURSK (a Russian attack submarine) was in the southern Barents Sea, performing a torpedo firing drill.   This is the “where”.  We’ll also frame this incident with respect to the impact to the goals.  The safety goal was impacted because all 118 sailors on board were killed.   The materials goal was impacted because of the loss of the submarine.  There are other goals that were impacted, but for our basic analysis, we will stop here.

Next we perform the analysis portion of the root cause analysis. We can begin by using the “5-Whys” technique.  We start with the impact to the safety goal, and ask “why” 5 times.  For example: Why was the safety goal impacted?  Because 118 sailors died.  Why?  Because of the explosion of missiles and torpedo fuel.  Why did the missiles and torpedo fuel explode?   Because of the impact when the submarine hit the bottom of the ocean.  Why did the submarine sink? A torpedo exploded, breaching the hull.  Why?   A fuel leak on the torpedo.  The resulting Cause Map is shown on the downloadable PDF.  Though the resulting Cause Map is accurate, it’s not complete.

We can add additional causes to make our map more complete.  For example, although 95 sailors were killed directly by the explosion, the remaining 23 sailors actually died from carbon monoxide poisoning because they were trapped in the aft compartment due to the submarine sinking.

A higher detail Cause Map is also shown on the downloadable PDF.  Even more detail can be added as the root cause analysis investigation continues.  The level of detail in a Cause Map is determined by the impact to the organization’s goals.  Because of the tragically high number of deaths in this incident, it will be worked to a very high detail.  The highest detail level Cause Map has more than 150 causes.

Eschede Train Derailment

Download PDFBy ThinkReliability Staff

June 3, 1998, a train derailed and crashed into a bridge near Eschede, Germany, killing 101 people, including 2 engineers who had been working on the bridge.  A thorough root cause analysis built as a Cause Map can capture all of the causes of this tragedy in a simple, intuitive format that fits on one page.We can begin our analysis with the “5 Whys” technique, asking “Why” 5 times.  1) Why did the train crash into a bridge?  It derailed.  2) Why did it derail?  A tire embedded in the railcar changed the switch.  3) Why was the tire embedded?  It had come off the wheel.  4) Why did the tire come off the wheel?  The tire broke.  5) Why did the tire break?  Fatigue cracking.  This forms the beginning of a root cause analysis investigation.

As we continue the investigation, we can create a more detailed root cause analysis.  We begin by defining the problem in terms of the impacts to the organization’s goals.  The safety goal was impacted because of the 101 deaths, and 88 injuries.  Also, the train suffered serious damage, resulting in an impact to the materials/labor cost goal.  These impacts to the goals form the basis for our Cause Map.

eschede-thumbnailThe goals were all impacted due to the destruction of the rear railcars.  This occurred because the train crashed into a bridge at 200 km/hour.  The train was not stopped or slowed because of company policy to investigate an  issue first.  The train crashed into the bridge because it had derailed because a tire embedded in the railcar collided with a switch guard rail.  The tire became embedded because it broke, due to fatigue cracking from wear and inadequate inspections, and an insufficient design.  The design was insufficient because the prototypes were not physically tested and dynamic repetitive forces were not considered in the modeling.

Even more detail can be added to this Cause Map as the analysis continues. As with any investigation the level of detail in the analysis is based on the impact of the incident on the organization’s overall goals.  Once the Cause Map is completed to the desired level of detail, solutions can be found for any of the cause boxes.  Solutions are then shown with the cause they control.

Pool Safety

Download PDFBy ThinkReliability Staff

Many of the examples of Cause Maps are investigations of an incident that has already taken place.  However, cause maps are also very useful as a proactive, preventative tool.  A thorough root cause analysis built as a Cause Map can capture all of the potential causes of concern in a simple, intuitive format that fits on one page.  Let’s say you have decided to get a pool for your household.  A Cause Map can help you identify the potential hazards of pool ownership, provide solutions for them when possible, and ensure that your pool experience is as safe as possible.

Preventing pool injuries is extremely important.  About 43,000 people each year are injured in and around swimming pools and 600 people drown.  Of the 600, approximately 260 are children under the age of 5.  Half of pool drownings occur in the yards of single-family homes.  Obviously, drowning is a concern when discussing pool safety, but the other top causes of injuries around pools are head injuries, slipping, and electrocution.  Some solutions to these problems are listed below, and are based on causes derived from the Cause Map. (To see the Cause Map, click on “Download PDF” above.)

POOL SAFETY SOLUTIONS:

1) Control access to the pool by using a self-latching, self-locking fence that is at least 4′ tall, that can’t be climbed.  Ensure the doors open outward from the pool and have a latch out of children’s reach.   Use a safety cover when the pool is not in use.
2) Employ drain safety devices such as pumps that shut off automatically when the pipes are obstructed.
3) Keep children within arm’s reach when near a pool.  Don’t put in a pool for your family until your children are at least 5.
4) Keep lifesaving equipment near the pool, including a hook and an approved life-saving flotation device.
5) Don’t drink & swim, and don’t let those who have consumed alcohol near the pool.
6) Take your whole family to swimming lessons.
7) Never swim alone.  Don’t let anybody else swim alone.
8) Use a pool alarm that senses water motion to determine if someone has entered the pool.  Make sure it is always turned on when the pool is not in use.
9) If a child is missing, look first in the pool (most children who drown are found after 10 minutes).
10) Keep a telephone, and emergency numbers, near the pool at all times.
11) Check the water depth before diving, or don’t allow diving in your pool.
12) Learn CPR.  Take your whole family (when they’re old enough) to CPR lessons, too.
13) Don’t allow running near the pool.
14) Use an absorbent material to surround the pool.
15) Use rough material around the pool (such as cement instead of tile).
16) Stay out of the pool during rain or lightning storms.
17) Keep electrical appliances away from the pool (they can cause electrocution even if they are not turned on).

Emergency Landing of American Airlines Flight 268

Downlaod PDFBy ThinkReliability Staff

On September 22, 2008 American Airlines Flight 268 en-route from Seattle to JFK Airport made an emergency landing at Chicago’s O’Hare Airport.  Nobody was injured, although the landing gear sustained some damage.  In order to determine what went wrong, we will perform a root cause analysis.  A thorough root cause analysis built as a Cause Map can capture all of the causes in a simple, intuitive format that fits on one page.First we’ll look at the impact to the goals.  An emergency landing is an impact to the customer service and production/schedule goal.  Additionally, the damage to the landing gear is an impact to the material/labor cost goal. We begin with the impacts to the goals, then ask “Why” questions to fill out the Cause Map.  For example, the damage to the landing gear occurred because the pilot steered the plane off the side of the runway.  The pilot steered the plane off the runway because of an obstruction at the end, and because of control issues, which occurred because of a failure of multiple cockpit systems.  The failure of these systems also caused the emergency landing.

The failure of the cockpit systems was caused by the battery power being depleted and not being recharged.  This occurred because the battery was powering four systems, and was disconnected from the main battery charger.  This happened because the standby power selector switch was moved to the “BAT” (or battery) position.  The standby selection switch was moved to battery because that is what procedure called for when the “Standby Power Bus OFF” light is illuminated.  The light was illuminated due to a relay failure, of unknown cause.

At this point, a problem becomes clear.  A pilot following procedure should not result in an emergency landing for a plane.  Thus, we have a procedural problem.  We will use a Process Map to draw out a procedure for more clarity to see where the specific issue lies.

Based on general information presented by the National Transportation Safety Board (NTSB), the illumination of the “Standby Power Bus OFF” light indicates a loss of power to the standby AC or DC bus.  If this occurs, the standby power selection knob should be turned to “BAT” (battery).  The battery should provide standby bus power. If the “Standby Power Bus OFF” light goes out, the standby power selection knob should be turned to “AUTO” which restores the battery charger.

Written in a paragraph, it can be difficult to see where the issue is.  But if we put it in a Process Map, we see a decision box for “Standby Power Bus OFF light remains illuminated.  If the answer is yes, we follow the procedure outlined above.  But if the answer is no, there is no procedure to follow.  This is the position the pilot of Flight 268 was in.  The “Standby Power Bus OFF” light went out, so the pilot left the standby power selection knob on “BAT”.  This drained the battery, resulting in the failure of various cockpit systems, as discussed above.

Even more detail can be added to this Cause Map as the root cause analysis continues. As with any investigation the level of detail in the analysis is based on the impact of the incident on the organization’s overall goals.
Salmonella Contamination in Peanut Products

Download PDFBy ThinkReliability Staff

In January, 2009, health officials discovered Salmonella typhimurium in a jar of peanut butter.  The Food and Drug Administration (FDA) was able to trace the contamination back to the Peanut Corporation of America (PCA)’s  Blakely, Georgia plant.   A root cause analysis built as a Cause Map can show the causes of this tragic, preventable incident in a simple, intuitive format that fits on one page.

To begin our root cause analysis, we start with the impact to the goals.  The peanut products contaminated with salmonella resulted in 700 reported illnesses.  This is an impact to the safety goal.   Also, PCA received a $14.6 million fine for shipping products contaminated with Salmonella.  This is an impact to the regulatory goal.  There are other goals that were impacted as well, but we will begin with these two.

People were sicked and PCA was fined because peanut products contaminated with Salmonella were shipped to consumers.  These products were able to be shipped because they were retested for Salmonella until the results were negative (this is illegal, by the way) and several lots of product were contaminated.

The product lots were contaminated because the processing line was exposed to Salmonella and was not cleaned after the contamination.  The two likely ways that the line was contaminated is either by exposure to rain (which can carry Salmonella) or by cross-contamination of finished product (which should have any microorganisms destroyed in the roasting process) and raw product (which hasn’t).  Additionally, the roasting process in the Blakely plant was inadequate to kill Salmonella.

The plant suffered from inadequate cleaning, which resulted from a line that was not able to be adequately sanitized, and from inadequate supervision.  The FDA had last inspected the plant in 2001, which is typical due to understaffing.   However, they might have visited sooner if the Salmonella test results (the ones that were re-done to get negative values) were shared with the FDA.  These results were not shared with the FDA, which is common industry practice.    State inspectors found only minor issues.

None of PCA’s customers appeared to have visited the site, possibly because they relied on an audit firm’s “superior” ranking.  This audit firm was paid by PCA.  There was also inadequate supervision due to inadequate leadership at the plant, which had no plant manager for a portion of 2008, and was missing a quality manager for four months.

Even more detail can be added to this Cause Map as the analysis continues. As with any investigation the level of detail in the analysis is based on the impact of the incident on the organization’s overall goals.
Chernobyl Reactor Explosion

by ThinkReliability Staff

On April 26, 1986, reactor #4 at the Chernobyl Power Plant exploded, spreading radioactive contamination.  There is much debate about the effects, the magnitude of the effects, and the causes, but we can put together a summary of the root cause analysis here.

It is estimated that thousands (perhaps tens of thousands) of people will die from the aftereffects of Chernobyl.  More than 4,000 children have contracted thryoid cancer.  Additionally, between 50 and 250 million Curies of radioactivity were released, more than 350,000 residents have been resettled, a large area remains contaminated, and over 20 countries received radioactive fallout.

The radioactivity, which had built up in the reactor, was released by an explosion and a fire that occurred due to an uncontrolled power surge.  Inadequate containment resulted in the radioactivity spreading beyond the plant.  The power surge resulted from several actions that increased power and disabled safety systems, and from an unsafe reactor design.  (The reactor was designed so that increased steam production leads to an increase in power. US reactor designs are the opposite.)

The after-effects of Chernobyl continue.  The applications of lessons learned from root cause analysis have been applied in many areas – nuclear power, evacuation planning, radiation health treatments, and food supply.  The only remaining reactors of this type are being shut down.  Hopefully this will not only ensure that another Chernobyl never occurs, but will also improve the safety of many other industries.

Finding Solutions

By ThinkReliability Staff

Once you’ve finished your root cause analysis, determined what the causes of a given incident are and built the Cause Map, now comes the really important part: how do you make sure it never happens again?  To keep an incident from happening again, an organization needs to implement solutions. The first step to implementing solutions is to find possible solutions.  We do this by brainstorming.  The brainstorming process is made easier by the root cause analysis, because instead of finding a solution for “person falls down stairs” we brainstorm solutions for very specific causes, such as “stairs were wet” and “handrail doesn’t extend far enough”.  There are many different methods for brainstorming, but the important point is: don’t discount any suggestions.  Write them down, and move on.  We’ll sort through them later.  Attach the solutions to the causes they control (for example, a solution to “stairs were wet” is “cover stairs from exposure to rain”).  Some causes won’t have any solutions, and some solutions will appear on more than one cause.

Have a wide variety of personnel available for brainstorming.  Sometimes it’s easier for someone farther from the work to see potential solutions, and sometimes the people who do the work every day will have great suggestions they’ve been waiting to bring up.  The more suggestions, the better!  Sometimes a seemingly crazy suggestion will lead to a very practical solution.  Allow people to add on to others’ suggestions.  This can result in a synergistic solution better than the original suggestion.

Once the brainstorming is complete, you’ll have a list of possible solutions.  There are as many ways to select solutions as there are to brainstorm, but I suggest something like the following.  First, make a list of the solutions.  Rate the effectiveness of each solution at preventing similar types of incidents (from 1 to 10, 1 being not very effective, 10 being very effective).   Then rate the ease of implementing the solution (from 1 to 10, 1 being not very easy to implement, 10 being very easy to implement).   Multiply the two together for each solution’s score.  Then, rank the solutions.  The solutions at the top will give you the most “bang for your buck”, or are the most easily-implemented, effective solutions.